Flood inundation refers to the submergence of land areas due to rising water levels during extreme weather events, such as heavy rainfall or overflowing rivers. Accurate mapping of flood-prone areas is crucial for disaster preparedness, emergency response, and effective damage assessment. By predicting which regions are most likely to be inundated, authorities can develop early warning systems, plan evacuation routes, and allocate resources more efficiently during flood events.
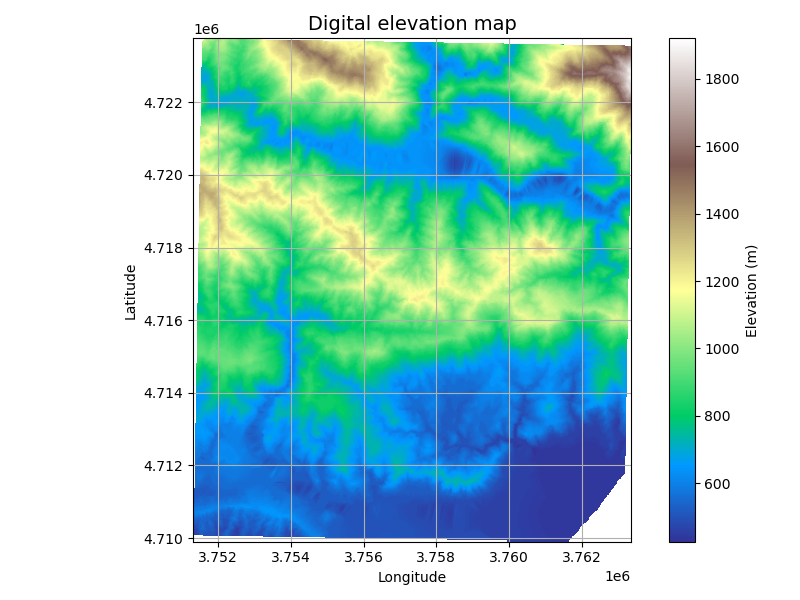
In this use case, flood inundation was modelled using contour data of the Sirmaur district in Himachal Pradesh available on the GDI platform. Contours are vector representations of topography, consisting of lines that connect points of equal elevation. These lines provide valuable information on the terrain, allowing for the generation of a Digital Elevation Model (DEM), which is a 3D representation of the surface. The DEM was created using cubic interpolation to ensure smooth transitions between different elevation points.

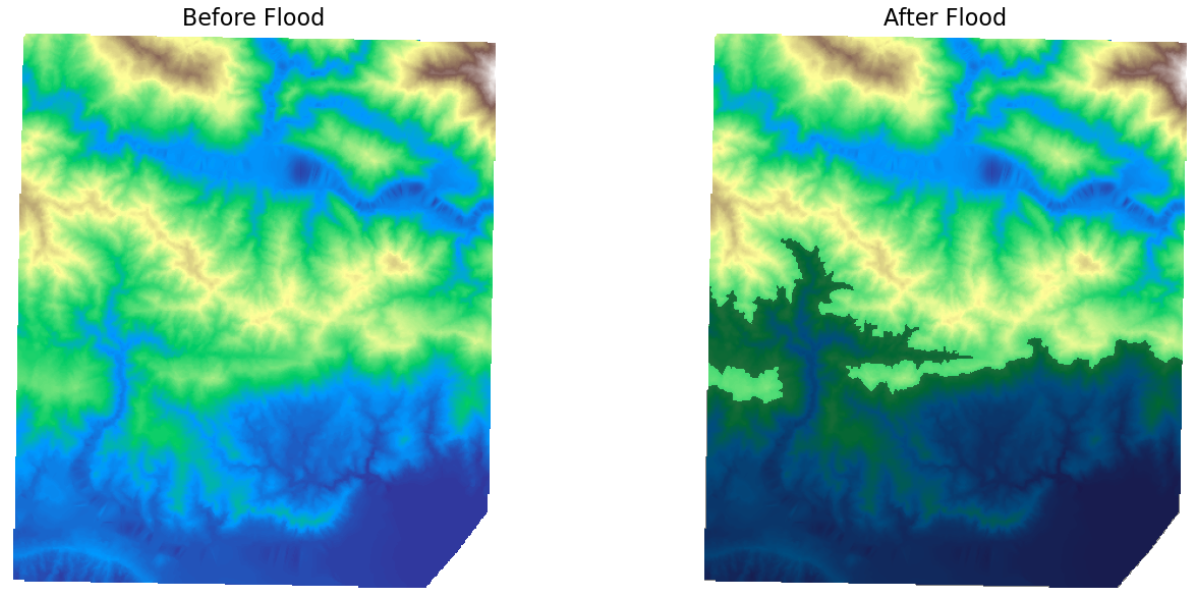
The flood inundation was mapped using a flood fill algorithm, which simulates how water would spread across the terrain in the event of flood. The algorithm starts at the lowest elevation point and fills all areas that fall below a specified threshold elevation, indicating the areas likely to be submerged. A binary image was generated from DEM based on the threshold value. The inputs to the algorithm were the (x, y) coordinates of the lowest point and this binary image.

Two types of outputs were created. The first was a static image showing the areas inundated at a single, specified threshold elevation, useful for understanding the impact of a specific water level rise. The second output was an animated sequence showing multiple flood scenarios by varying the threshold elevation. This animation provides a dynamic visualisation of how flooding could progress under different conditions. These outputs are highly valuable for disaster preparedness and emergency response planning. The static maps help identify high-risk areas that may need protection or evacuation, while the animated sequences offer insights into how the flood could evolve over time. Such tools can assist in early warning systems, optimise resource allocation during floods, and aid in post-flood damage assessment.
Authors
Dr Linda Theres
Related Posts

- GDI
- April 24, 2025
GDI Wins National Geospatial Practitioner Award 2024 for Advancing Open-Source Innovation
We are thrilled to share that the Integrated Geospatial Data-sharing Interface (GDI), developed ..

- GDI
- April 24, 2025
Exclusive workshops for SOI by CDPG
CDPG successfully hosted its inaugural One-Day Workshop on the Integrated Geospatial Data-shari ..

- GDI
- July 23, 2024
Urban Sprawl along the Indian coastlines using Data
Urban sprawl around India’s coastline is a growing concern as the nation continues to urb ..


