Rapid urbanisation causes several issues, including the Urban Heat Island (UHI) effect, where urban areas experience significantly higher temperatures than their rural surroundings. This is due to several factors associated with urbanisation, including the replacement of vegetation with buildings, roads, and other impermeable surfaces that absorb and retain heat. Additionally, heat emissions from industries and vehicles also contribute to the UHI effect in urban areas (Sidiqui et al. 2022; Bagyaraj et al. 2023).
Moreover, common construction materials such as asphalt, concrete, iron, and glass absorb more heat, further intensifying temperatures in urban areas. The UHI effect can lead to increased energy costs, more heat-related illnesses and deaths, greater pressure on water resources and worsened air pollution (Yuan et al. 2022;Chakraborty et al. 2023).
Bengaluru, once known for its pleasant climate, now faces increasing temperatures due to climate change and other factors such as rising greenhouse gas emissions, loss of green cover, and rapid urbanisation, and anthropogenic factors such as aerosol emissions from factories and vehicles (). The transformation of diverse natural land surfaces such as vegetation cover, water bodies, and bare soil into built-up areas has led to an increase in Bengaluru’s average land surface temperature (LST) by 0.99 °C. (Arunab and Mathew 2023).
Analysing these temperature changes is crucial for planning effective mitigation strategies. One of the ways to study this phenomena is geospatial data. Thermal Infrared (TIR) bands, in the satellite measure emitted thermal radiation, allowing for the estimation of Land Surface Temperature (LST) and the identification of Urban Heat Island (UHI) and its intensity and extent. Additionally, this data facilitates temporal analysis, enabling the monitoring of changes in urban temperatures over time.
Remote sensing data from satellites such as Landsat, Sentinel-2, and MODIS (Moderate Resolution Imaging Spectroradiometer) are widely used to assess Land Surface Temperature (LST). Landsat and sentinel-2 satellites are known for their high spatial resolution, providing thermal infrared imagery that allows for precise mapping of surface temperatures across urban landscapes. In contrast, MODIS derived LST product with its broader spectral range and frequent revisit times, offers valuable LST data at a larger spatial scale, making it suitable for monitoring UHI effects over extensive regions.
The data used in this use case includes the VNP21A1D: Day Land Surface Temperature and Emissivity Daily (1 km resolution) from 2019 to 2022, the MOD21A1N.061 Terra Land Surface Temperature and 3-Band Emissivity Daily (1 km resolution) from 2023 to 2024 as well as the ward boundary shapefile for Bengaluru from the Survey of India (SOI). As part of the National Geospatial Policy, 2022 SOI has made its datasets publicly accessible, with many available through the Integrated Geospatial Data-Sharing Interface (GDI) at https://catalogue.gsx.org.in/datasets. The processed LST datasets used in this use case are available on the GDI at https://catalogue.gsx.org.in/dataset/cab3f85f-83a5-4dc3-bf2c-22e351871747.
Table 1 Shows the datasets used in the use cases, their resolution and source.
| Datasets | Spatial Resolution | Temporal Resolution | Source |
|---|---|---|---|
| MOD21A1N.061 | 1 km | Daily | https://lpdaac.usgs.gov/products/mod21a1nv061/ |
| VNP21A1D | 1 km | Daily | https://lpdaac.usgs.gov/products/vnp21a1dv001/ |
| Ward boundary shapefile. | – | – | GDI |
Initially, LST datasets for Bengaluru were downloaded for the period from January 1, 2019, to April 30, 2024, and monthly mean composites, as well as yearly long-term mean composites, were prepared for each year. Subsequently, the monthly and annual mean LST data from 2019 to 2024 were spatially joined to the SOI shapefile of Bengaluru ward boundaries.
The use case demonstrates the mean monthly trends of LST, spatial distribution of yearly mean LST across different wards, region-wise temperature differences between daytime and nighttime, and yearly comparisons of the spatial-temporal distribution of anomalies, which encompass upper anomalies, lower anomalies, and overall LST trends. It also examines the relationship between LST and precipitation (Fig. 1 to 6). This comprehensive analysis provides valuable insights into the temporal variations in land surface temperature across Bengaluru, facilitating a better understanding and management of urban heat dynamics. To explore the use case please visit (https://heatislandstories.iudx.org.in/).
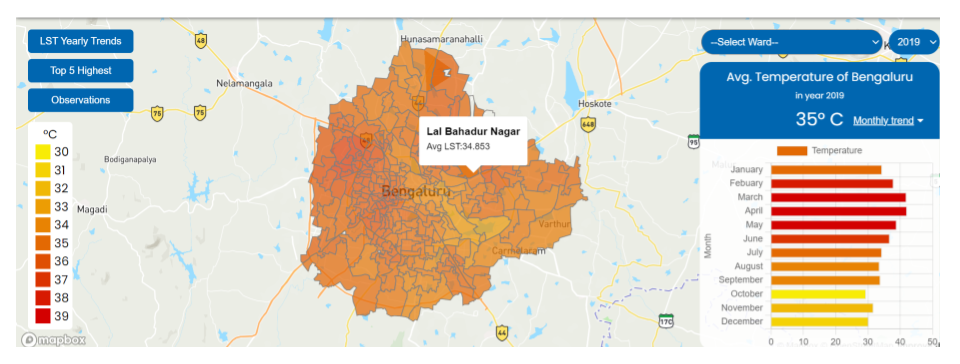
Figure 1: Mean Monthly and Yearly LST
Fig. 1 Showing the ward-wise spatial distribution of Mean LST in Bengaluru during 2019. The monthly temperature variation is also depicted on the right. The maximum temperature (39°C) was observed from February to May while the minimum temperature of 30°C was recorded in the month of October followed by December and November.
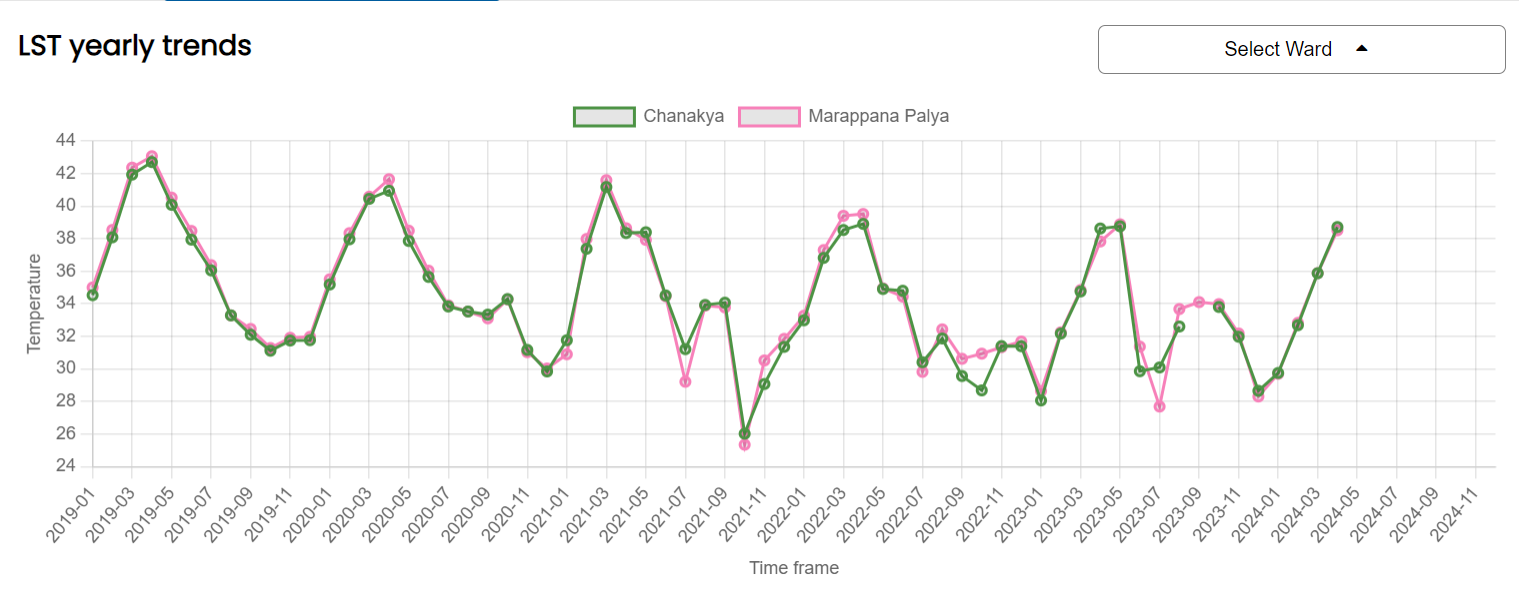
Figure 2: Mean Monthly and Yearly LST
Figure 2 shows the monthly mean temperature trends from 2019 to 2024 for the Chanakya and Marappana Palya wards. The Y-axis displays the monthly mean temperature in °C, while the X-axis represents the time frame (year and month). The trend indicates that the highest temperatures in both wards occur in March and April, with a notable peak in April 2019, where the mean temperature exceeded 42°C. Conversely, the lowest temperatures are observed in October, with the lowest mean temperature recorded around 26°C in October 2021.
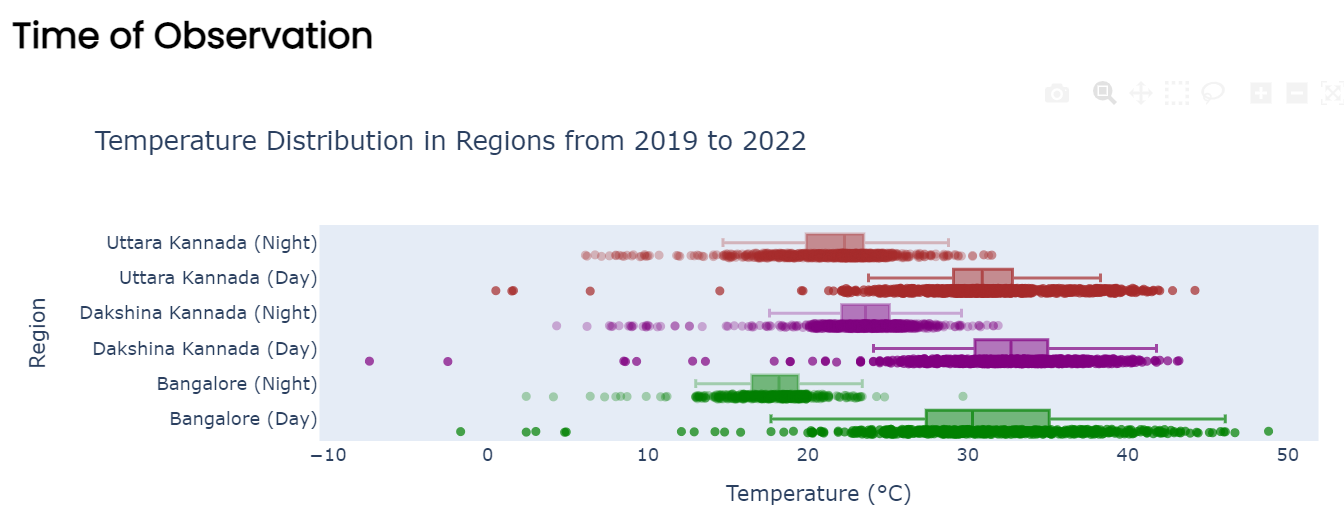
Figure 3: Temperature Distribution Day and Night
Figure 3 shows the regional day night temperature distribution in the district from 2019 to 2022. The plot reveals that the temperature differences between day and night in these regions are notably significant, with land surface temperatures being higher during the day compared to night. These substantial variations may indicate the presence of heat islands.
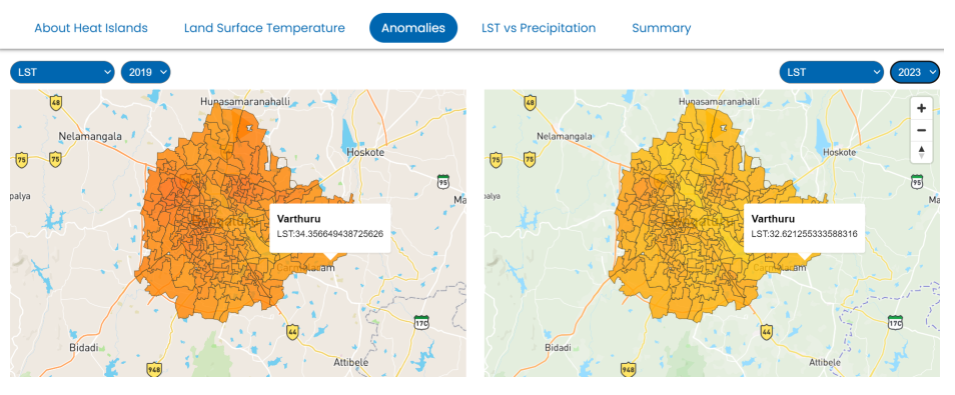
Figure 4: Anomalies
Figure 4 showing the spatio-temporal changes in LST between 2019 and 2023. The analysis reveals that the spatial distribution of LST was generally higher across almost all wards in 2019 compared to 2023.
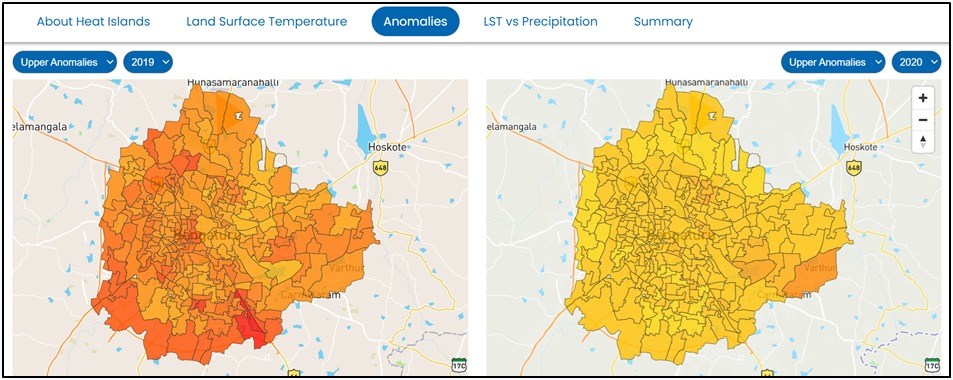
Figure 5
Figure 5 Shows upper anomalies of LST measured using the Z-score approach. This indicates that the LST values are higher than the expected average for a particular time or region. The Upper anomalies were significantly greater during 2019 as compared to the upper anomalies during 2020, highlighting areas that experienced unusually warm surface temperatures relative to normal conditions during 2019.
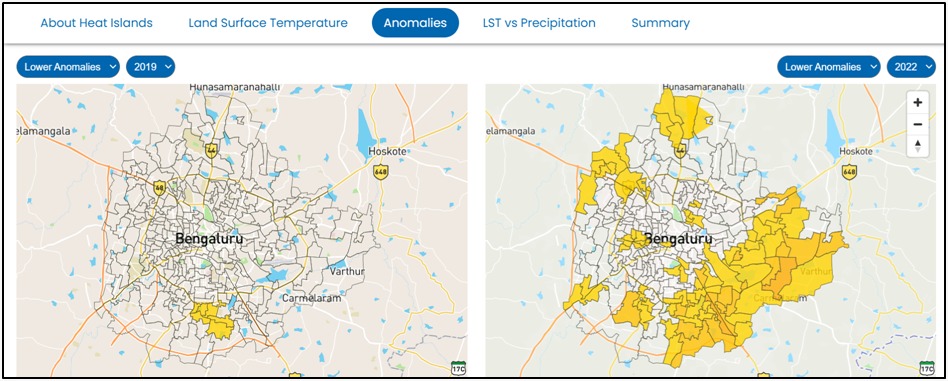
Figure 6
Figure 6 Shows lower anomalies of LST measured using the Z-score approach. This indicates that the LST values are lower than the expected average or baseline, representing areas that are cooler than normal. During 2022, many wards recorded lower anomalies, whereas during 2019, only a few wards experienced low anomalies.
References
- Arunab KS, Mathew A (2023). Geospatial and statistical analysis of urban heat islands and thermally vulnerable zones in Bangalore and Hyderabad cities in India. Remote Sensing Applications: Society and Environment. https://doi.org/10.1016/j.rsase.2023.101049
- Bagyaraj M, Senapathi V, Karthikeyan S, Chung SY , Khatibi R, Nadiri AA, Lajayer BA (2023). A study of urban heat island effects using remote sensing and GIS techniques in Kancheepuram, Tamil Nadu, India. Urban Climate (15). https://doi.org/10.1016/j.uclim.2023.101597
- Chakraborty TC, Newman AJ, Qian Y, Hsu A, Sheriff G (2023). Residential segregation and outdoor urban moist heat stress disparities in the United States. One Earth 6:(6) https://doi.org/10.1016/j.oneear.2023.05.016
Related Posts


