Introduction
Groundwater forms the backbone of water security for millions across India, serving as a primary source for drinking, irrigation, and industrial use. Yet, as demand increases, groundwater contamination and over-extraction are growing concerns. This calls for the need for systematic and scalable groundwater quality assessment across diverse geographies. This study presents a modern, geospatially enabled approach to understanding groundwater health. It combines the chemical insight of the Piper plot with the usability focused Water Quality Index (WQI) to deliver both scientific depth and actionable clarity.
Leveraging national-level groundwater quality data for the year 2015, from the Integrated Geospatial Data-sharing Interface (GDI link), the study introduces a dynamic dashboard that empowers users to explore, analyze, and interpret groundwater quality across India. To facilitate localized exploration and interpretation, the interactive dashboard integrates spatial data upload, exploratory statistics, groundwater chemistry visualization, and water quality assessment tools. This dashboard serves as a practical decision-support system for understanding the current status of groundwater quality and guiding necessary interventions. From identifying dominant water types to mapping potability classes, the application bridges data with decision-making. It transforms raw groundwater records into region-specific insights that can inform sustainable water management and public health strategies.
Dashboard Overview:
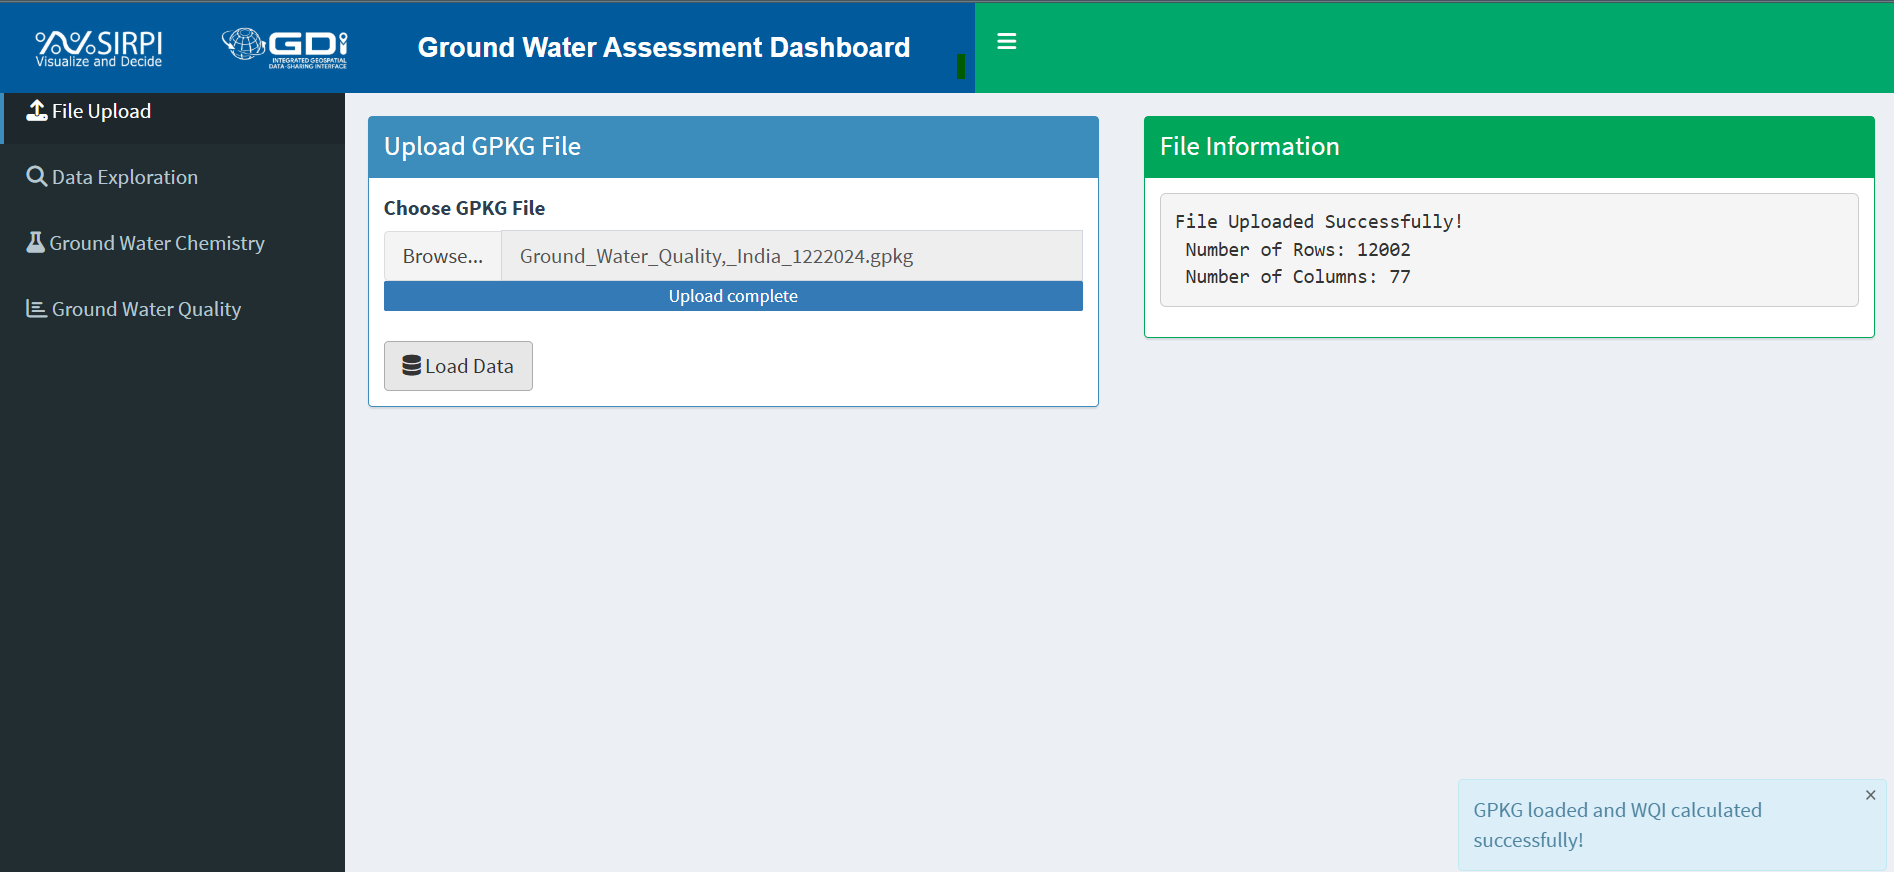
The dashboard is structured into four functional modules, enabling users to systematically analyze groundwater data. The first module allows users to upload GeoPackage (GPKG) files obtained from the GDI platform. These files contain spatial and attribute data related to groundwater sampling points, including parameters necessary for chemical and quality analysis.
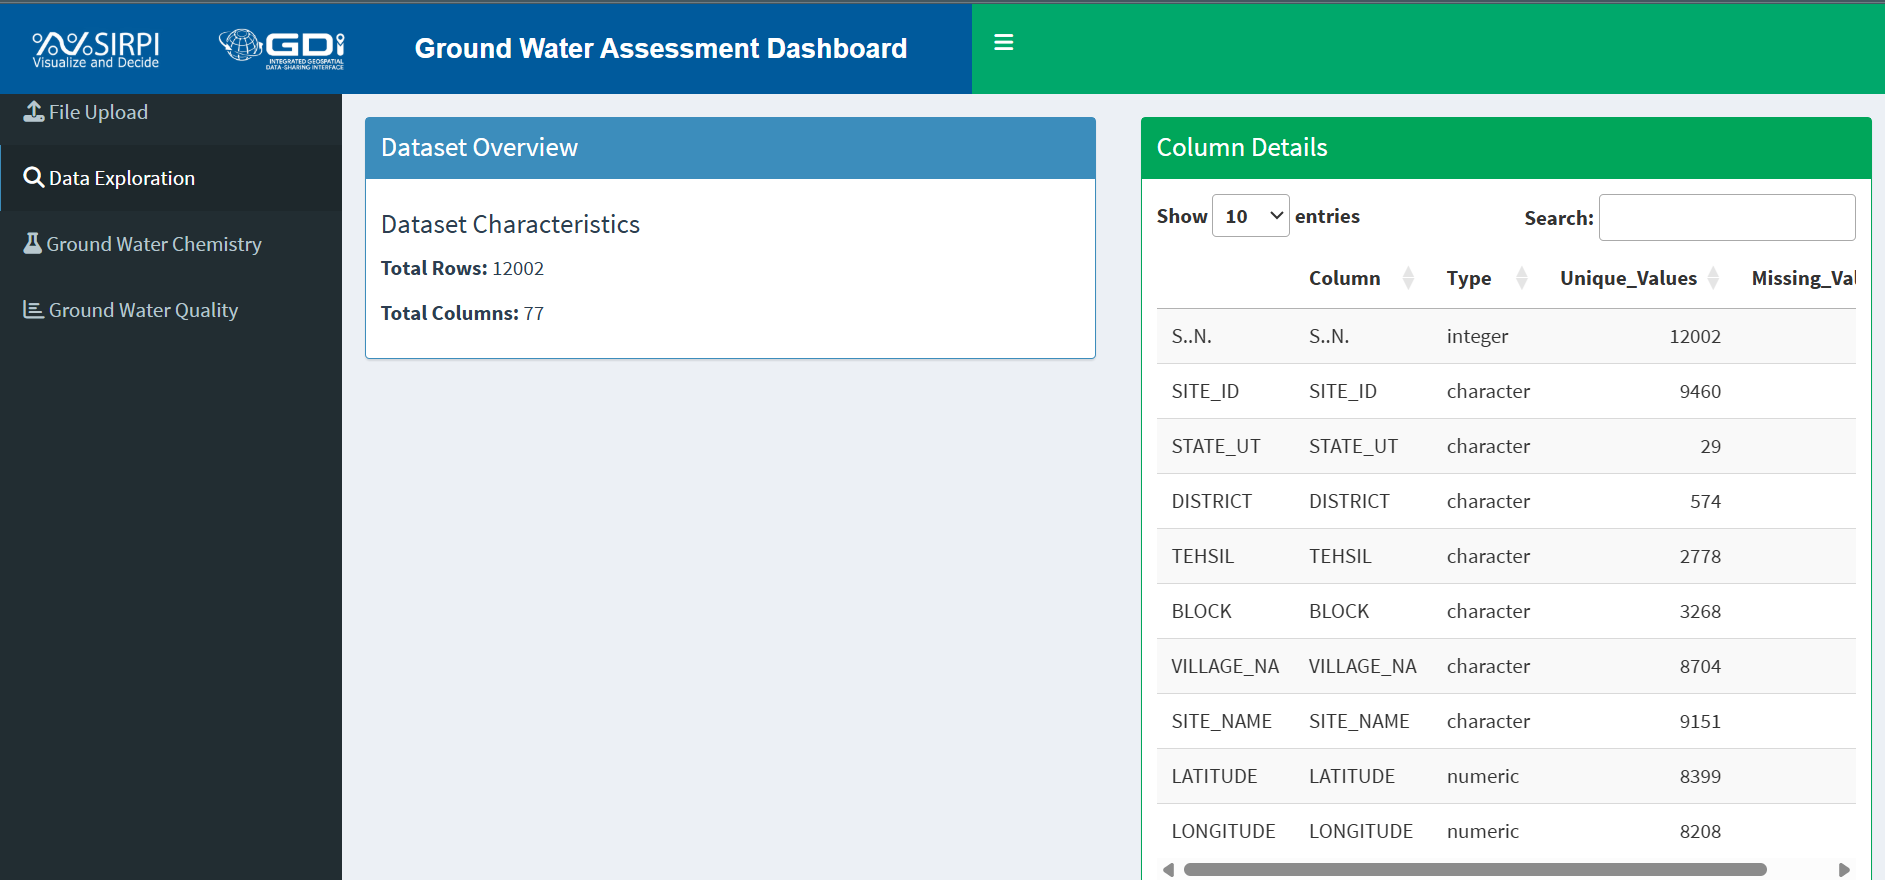
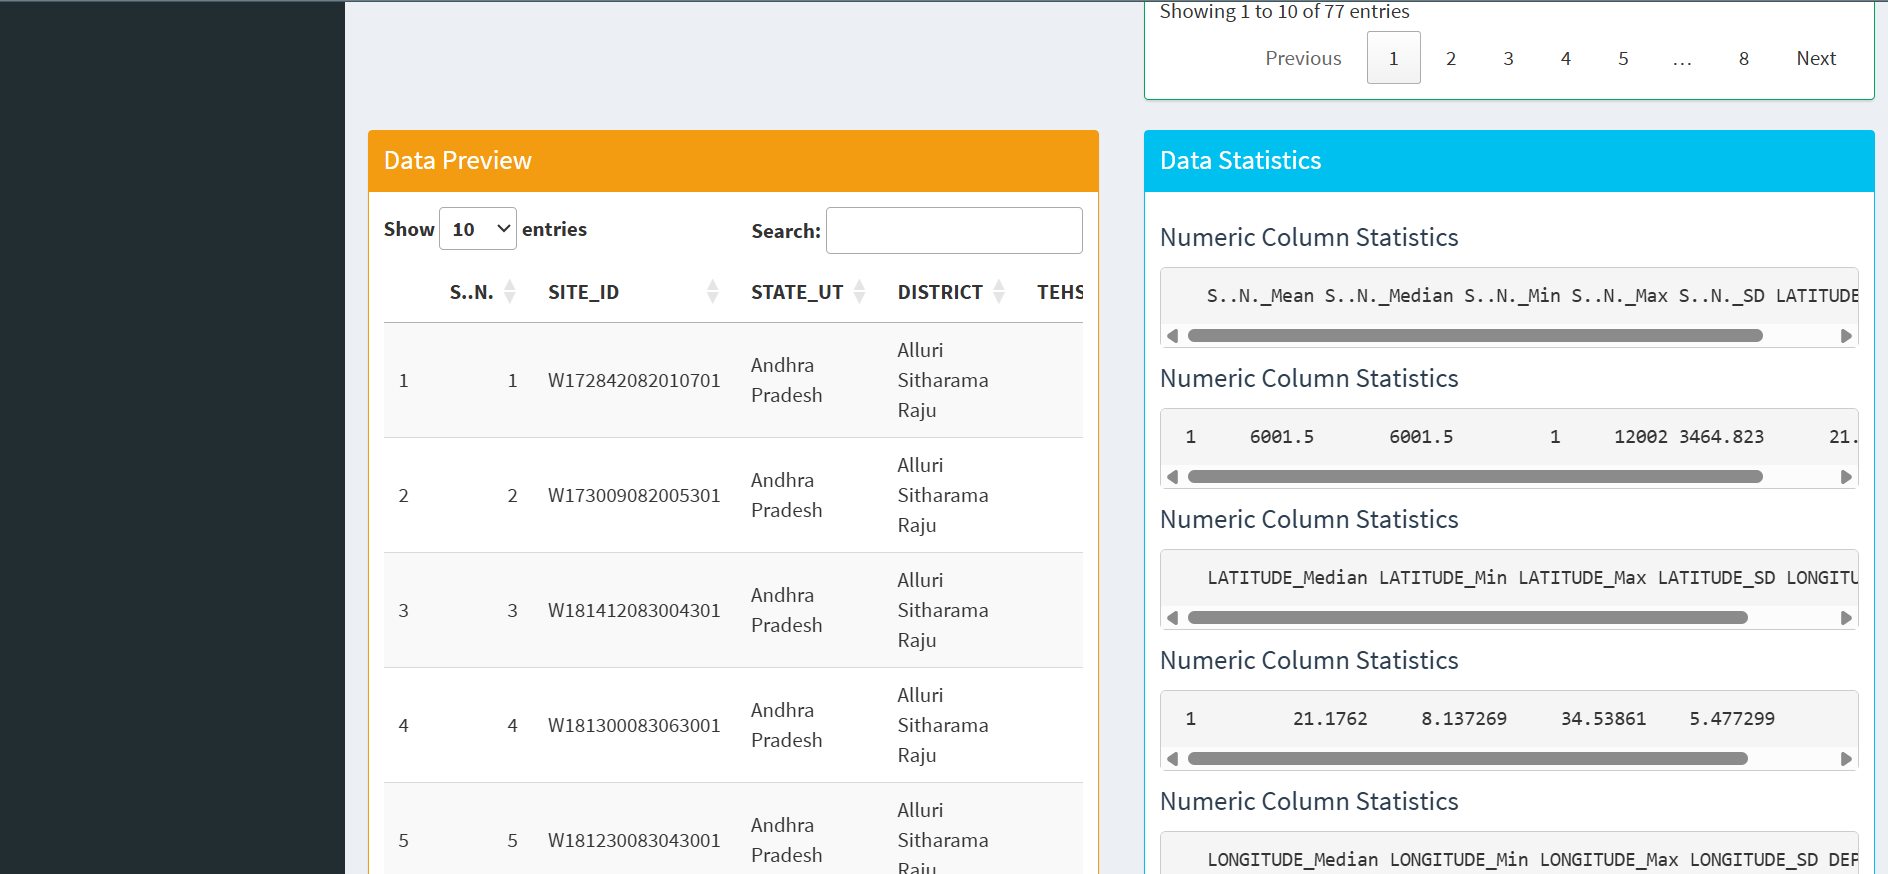
The second module focuses on data exploration, providing users with an interface to view the attribute table, analyze summary statistics, and inspect column-wise distributions. This step helps users understand the structure and completeness of the dataset before proceeding to more detailed analysis.
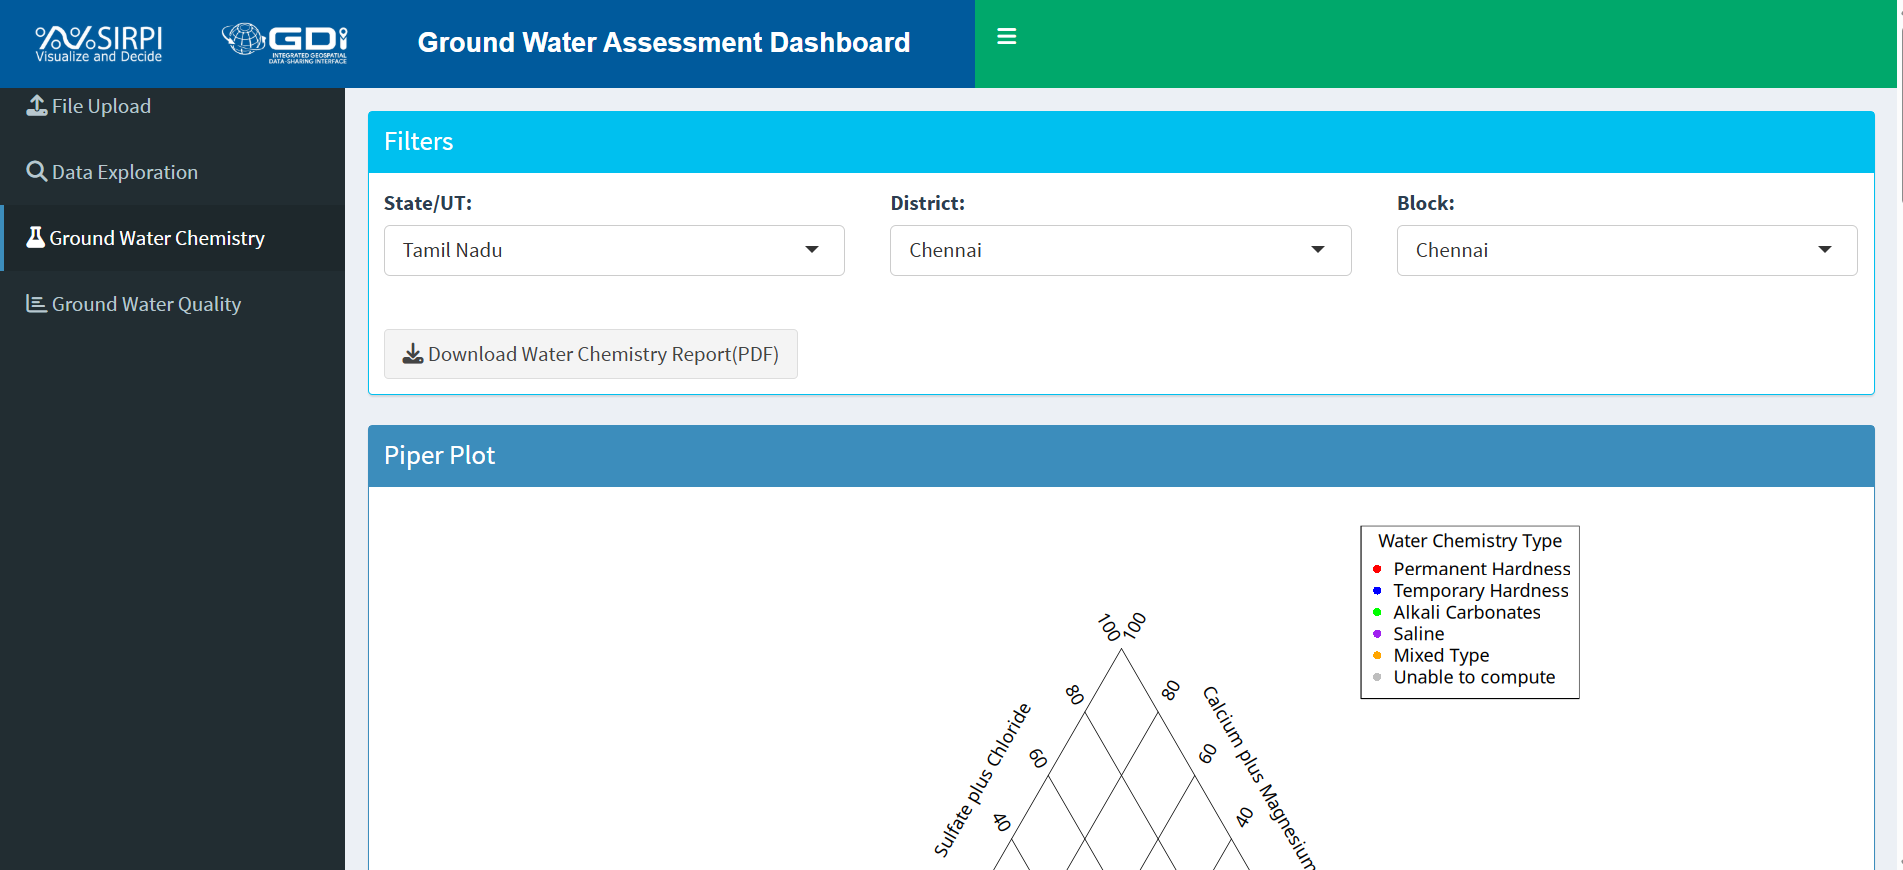
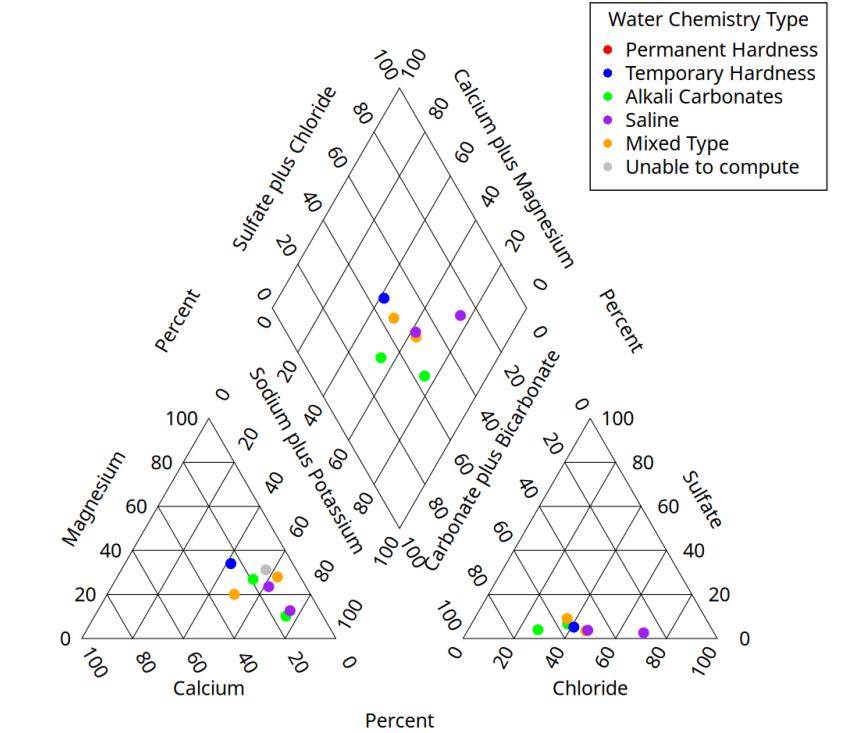
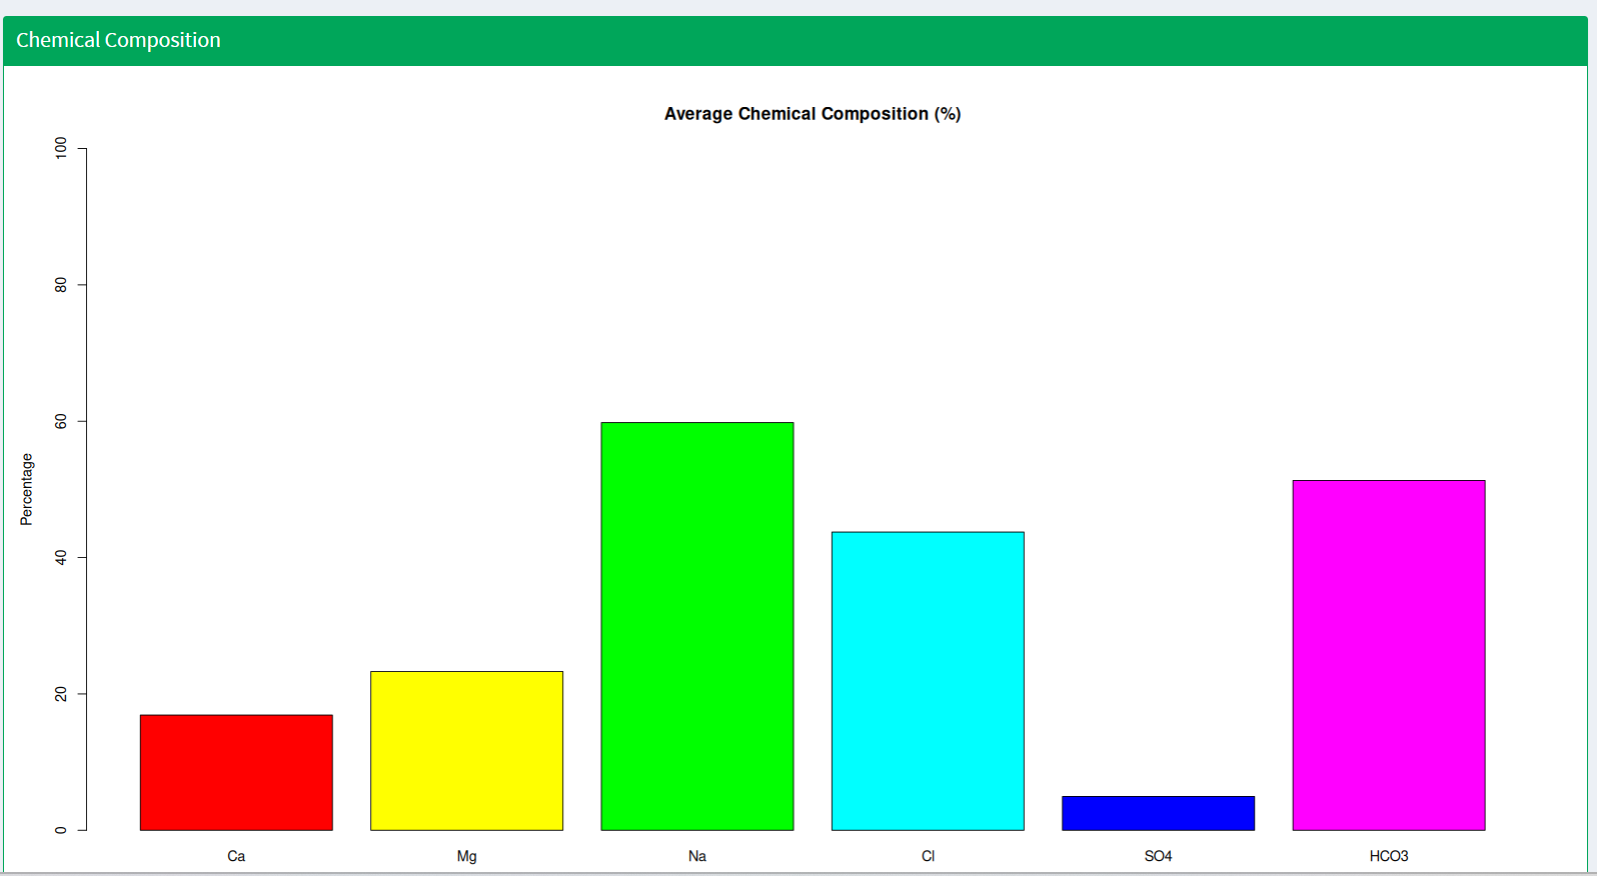
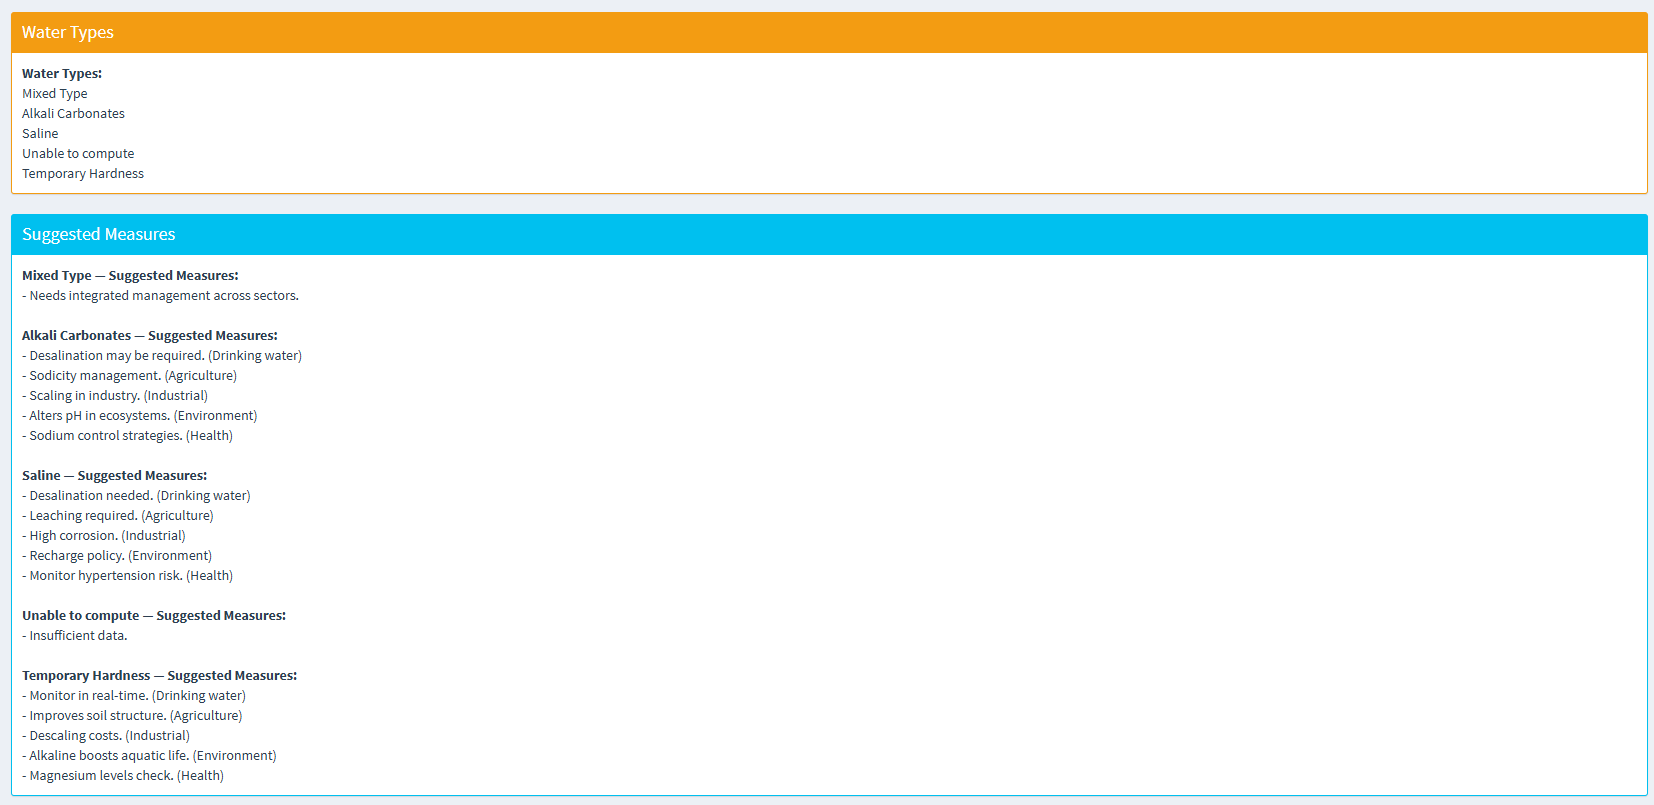
The third module offers groundwater chemistry analysis using the Piper plot. By selecting a state, district, or block, users can generate Piper plots that categorize sampling points based on major ionic compositions (Permanent Hardness, Temporary Hardness, Alkali Carbonates, Saline, Mixed Type, Unable to compute), helping identify water types such as calcium bicarbonate, mixed types, or sodium chloride. Additionally, bar charts display concentrations of key anions and cations, including calcium, magnesium, sodium, potassium, chloride, sulphate, bicarbonate, and fluoride. This module includes a report download option, which provides an overview of the Piper plot method, a summary of findings specific to the selected region, and recommended measures to address chemical imbalances or contamination trends observed in the groundwater samples.
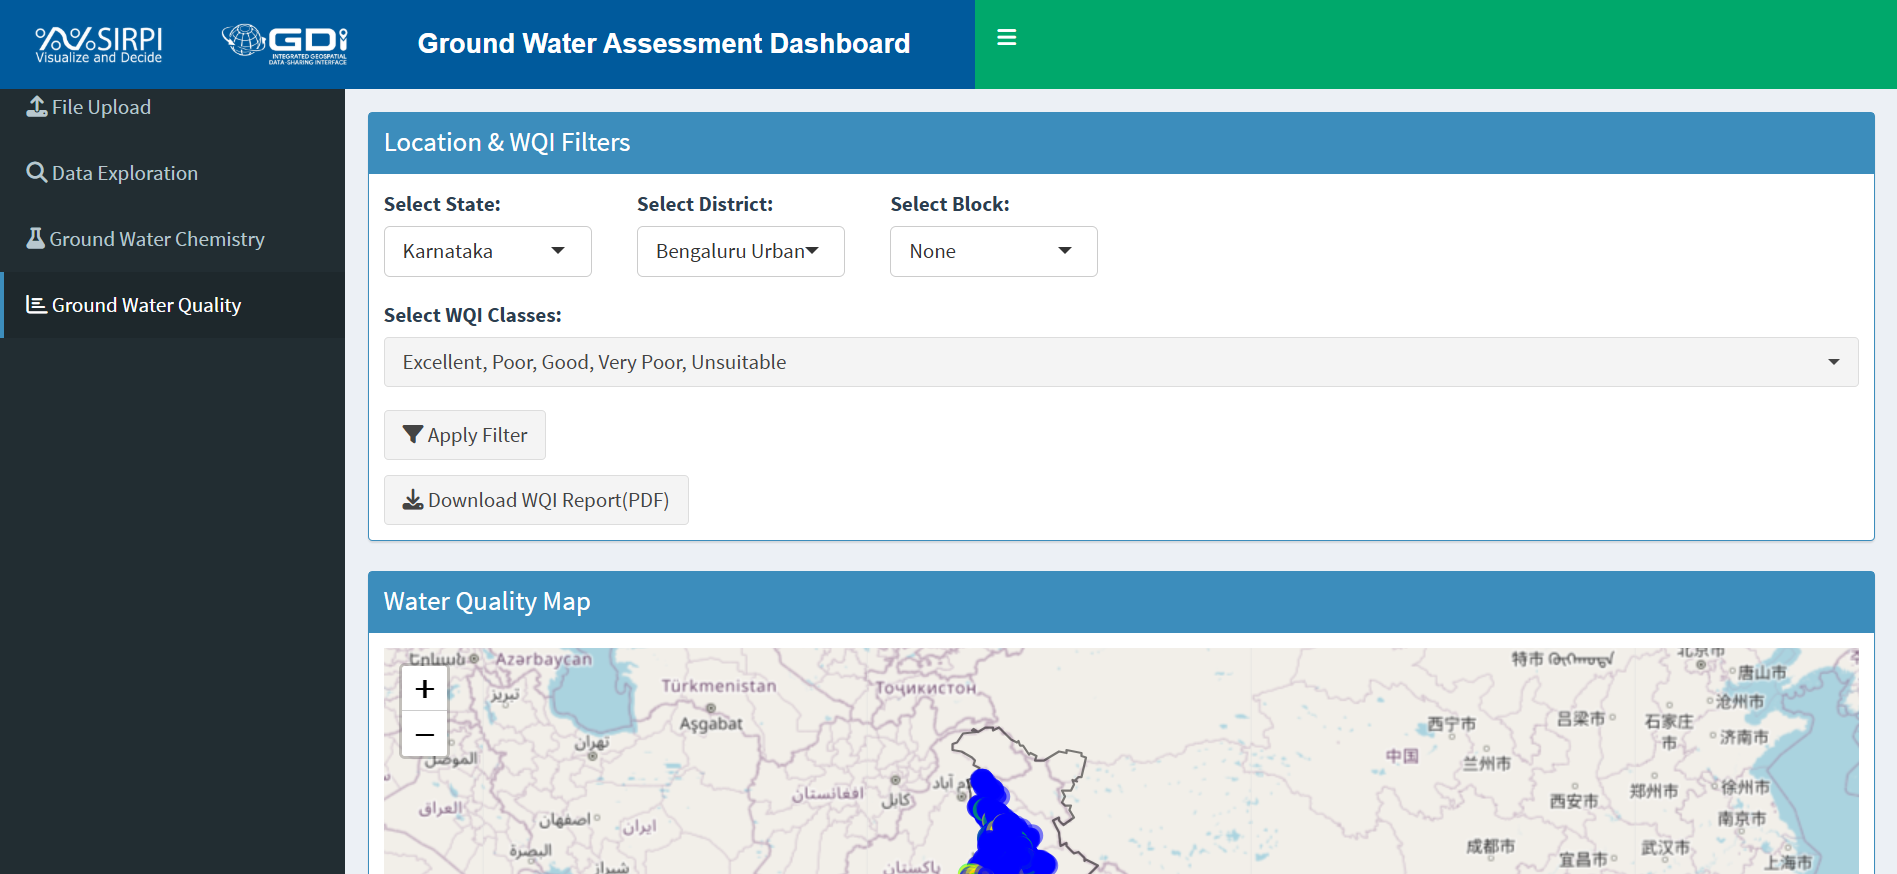
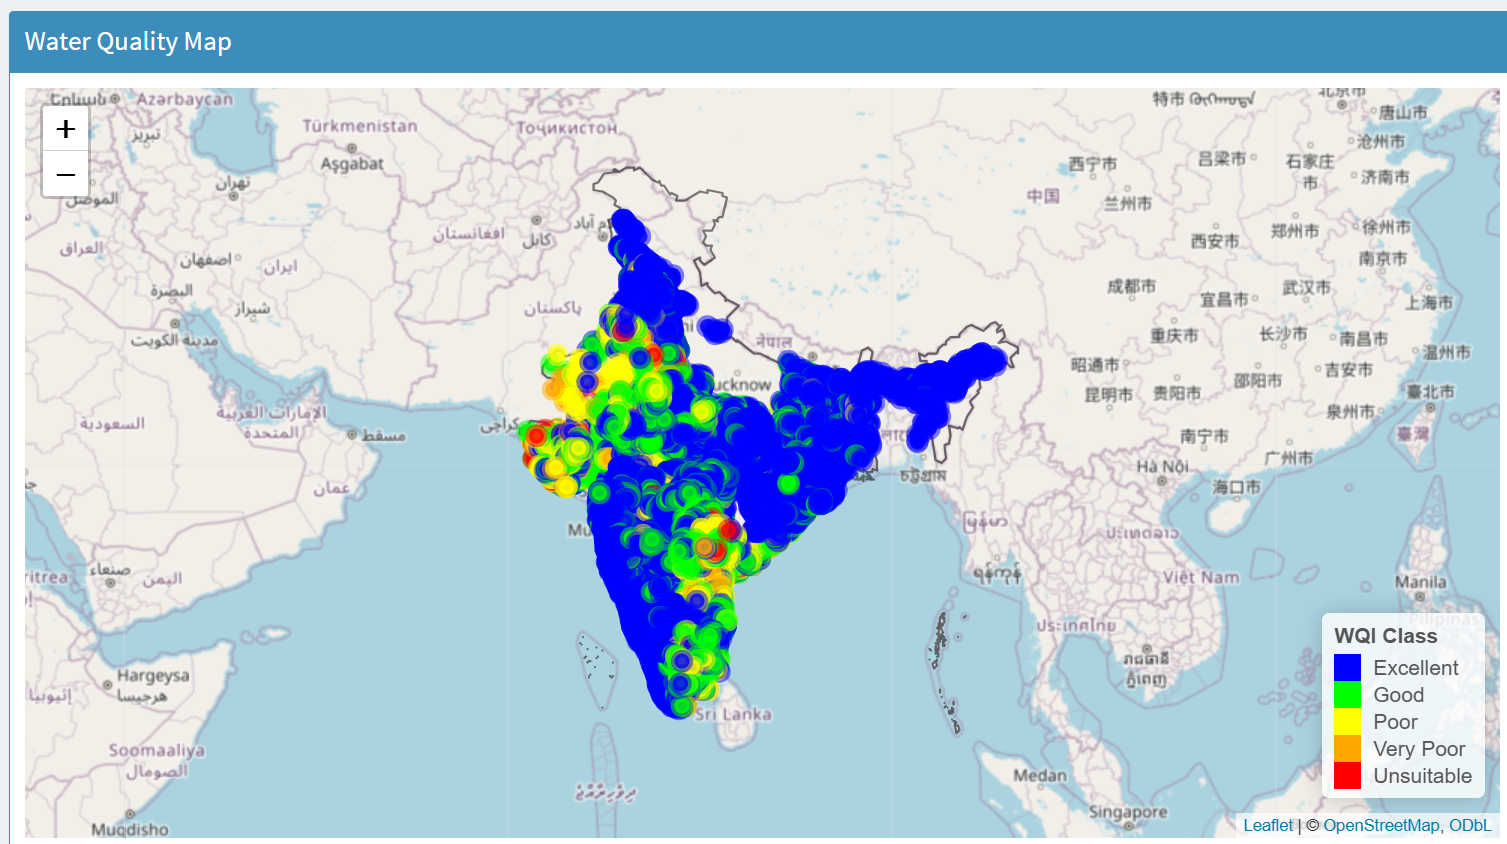
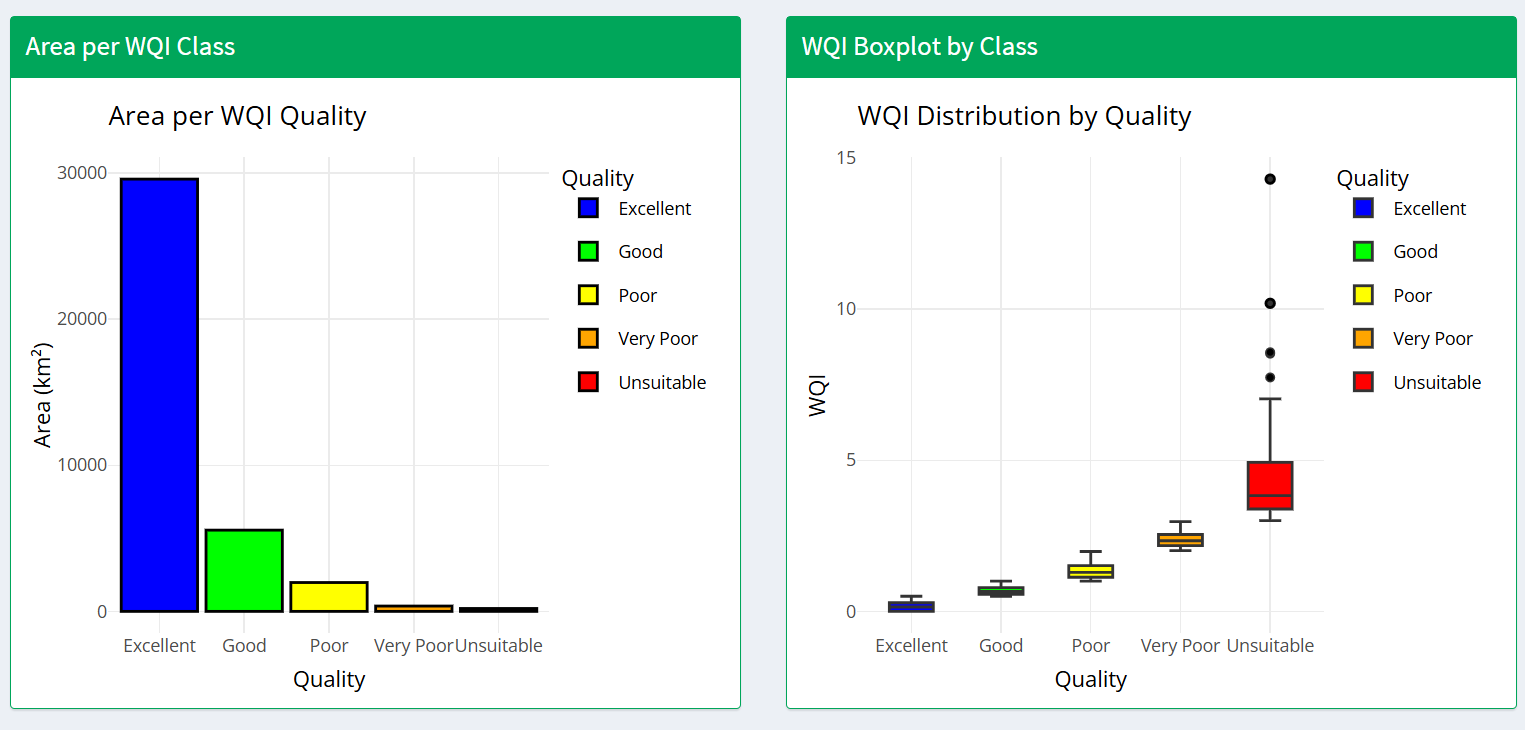
The fourth module is dedicated to groundwater suitability assessment using the Water Quality Index. Users can again select their area of interest by state, district, or block, and view classified groundwater quality points on an interactive map. The WQI is computed using parameters such as TDS, electrical conductivity, nitrate, sulphate, chloride, bicarbonate, fluoride, calcium, magnesium, sodium, and potassium. Each parameter is compared against standard permissible limits derived from literature (https://doi.org/10.21698/rjeec.2020.214), and weighted scores are used to determine an overall index. Based on the final WQI score, the water quality is categorized into five classes: Excellent, Good, Poor, Very Poor, and Unsuitable. This module also includes a downloadable report that outlines the WQI computation methodology, visual and tabular classification results, and interpretative insights for the selected area.
Conclusion
This dashboard-based application provides a robust, interactive platform for assessing groundwater chemistry and quality across India. By combining Piper plot analysis and Water Quality Index computation within a user-friendly geospatial environment, it enables stakeholders to better understand regional groundwater characteristics and make informed decisions. The availability of structured reports further enhances its utility for planners, researchers, and policymakers involved in water resource management. The application not only identifies areas with compromised groundwater quality but also suggests potential corrective measures, contributing to the broader goal of sustainable groundwater governance.
Explore the application: https://groundwaterinsights.sirpi.co.in/
Authors
Dr Linda Theres
Related Posts


