Overview
The Flood Impact and Response System (FIRS) Dashboard provides a localized, interactive platform tailored to Varanasi’s flood-prone environment, combining flood inundation simulation with evacuation route planning through elevation-aware routing and clustering techniques. In contrast to broader national and state platforms such as the Central Water Commission’s flood forecasting portal or state disaster management dashboards FIRS delivers fine-scale, village-level decision support aligned with local administrative boundaries and known evacuation sites.
The FIRS (Flood Information and Response System) is built using Python Shiny, which manages the system’s logic, user interactions, and dynamic updates, enabling real-time data-driven decisions. Spatial and optimization algorithms in Python handle key tasks such as computing village centroids, identifying safe evacuation centers, and generating optimal evacuation routes. Data preprocessing and management are carried out using Pandas, ensuring efficient handling of large datasets and maintaining data integrity throughout the workflow.
The user interface of FIRS is built with HTML and CSS for a clean, responsive layout. JavaScript is used to convert CSV data into JSON, enabling dynamic visualizations and real-time updates. For mapping, the system uses Leaflet, which allows accurate and interactive display of village centroids, evacuation centers, and optimized routes. Together, these frameworks create an efficient and user-friendly platform for flood risk assessment and evacuation planning.
The dashboard is structured into two functional modules: the Flood Inundation Visualizer and the Evacuation Planner.
Flood Inundation Mapping:
The Flood Impact and Response System (FIRS) interface provides an intuitive way to model flood inundation using Digital Elevation Model (DEM) data. The system employs a threshold-based flood fill algorithm, which first converts the Digital Elevation Model into a binary raster, marking all pixels below the selected elevation as potential flood zones. Using the lowest-elevation point along the riverbank as the seed, the algorithm performs a connected-region traversal to delineate only those low-lying areas that are hydrologically reachable, thereby filtering out isolated depressions that would not naturally flood. The dashboard provides real-time visualization of both the “before flood” terrain and “after flood” inundation layer, dynamically updating results as the elevation threshold slider is adjusted. Additionally, an animation feature illustrates the progressive spread of floodwaters, enhancing user understanding of flood dynamics. By combining elevation-driven modeling with interactive visualization, the flood inundation mapping module provides fast, actionable insights essential for early warning, damage assessment, and emergency planning in flood-prone urban environments. A color-coded elevation legend green for low areas, yellow for moderate elevation, and brown for high ground helps users interpret the map easily. As the slider moves, the system recalculates and updates the flood extent in real time, showing how rising water levels could impact different parts of Varanasi. This interactive design enables quick assessment of vulnerable zones and supports informed decision-making during flood events.
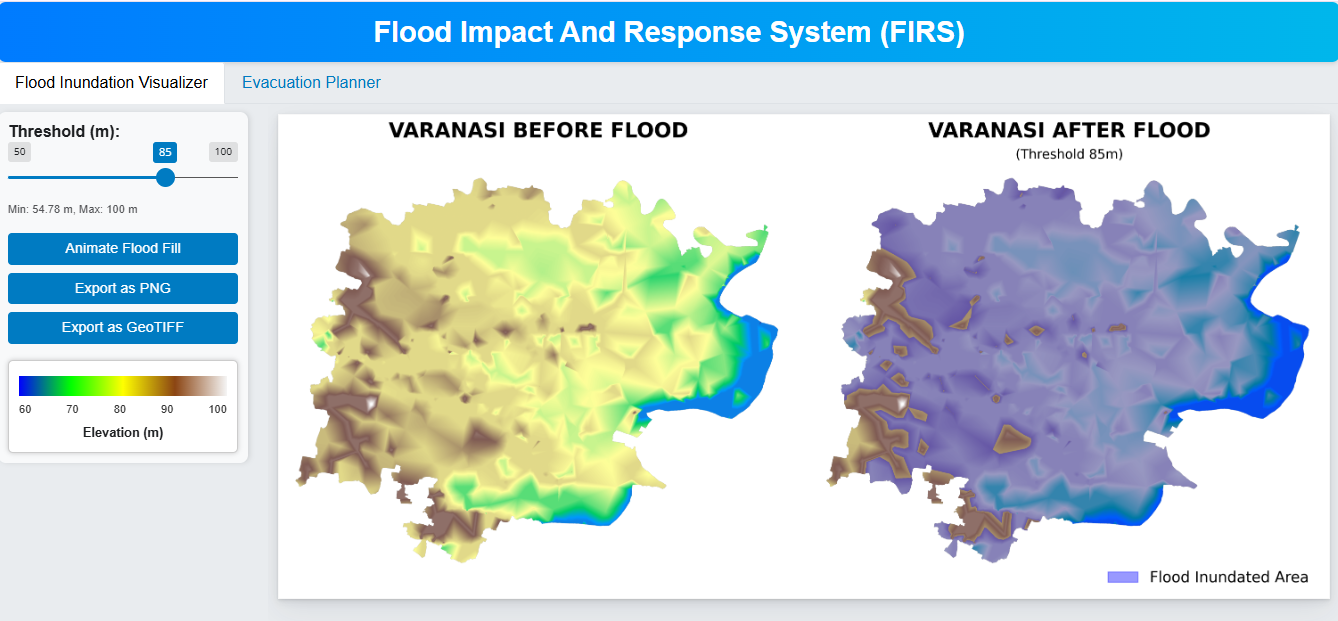
Figure 1. Flood Inundation Visualizer illustrating the pre- and post-flood scenario derived using an elevation threshold of 85 m.
Flood Evacuation Route Planner:
The Evacuation Planner module of the FIRS dashboard delivers a sophisticated, elevation-aware decision-support system designed to guide safe and efficient evacuation during flood events. Leveraging the DEM-based inundation layer, the module first identifies all affected village centroids and applies K-Means clustering to form spatially coherent evacuation zones, reducing routing redundancy and improving computational efficiency. Each cluster is assigned a representative village centroid that functions as the primary origin for evacuation modeling. A topologically clean, elevation-annotated road network is then integrated, where each edge is weighted using a hybrid cost function combining Euclidean distance with elevation-based penalties to avoid vulnerable, low-lying segments. The system employs a modified Dijkstra algorithm with early-exit optimization to rapidly compute elevation constrained routes to the five nearest education or healthcare facilities identified as potential evacuation centers. Results are visualized through an interactive map and a detailed tabular interface that reports optimal routes, recommended centers, distances, estimated travel times, and centroid coordinates for each village.
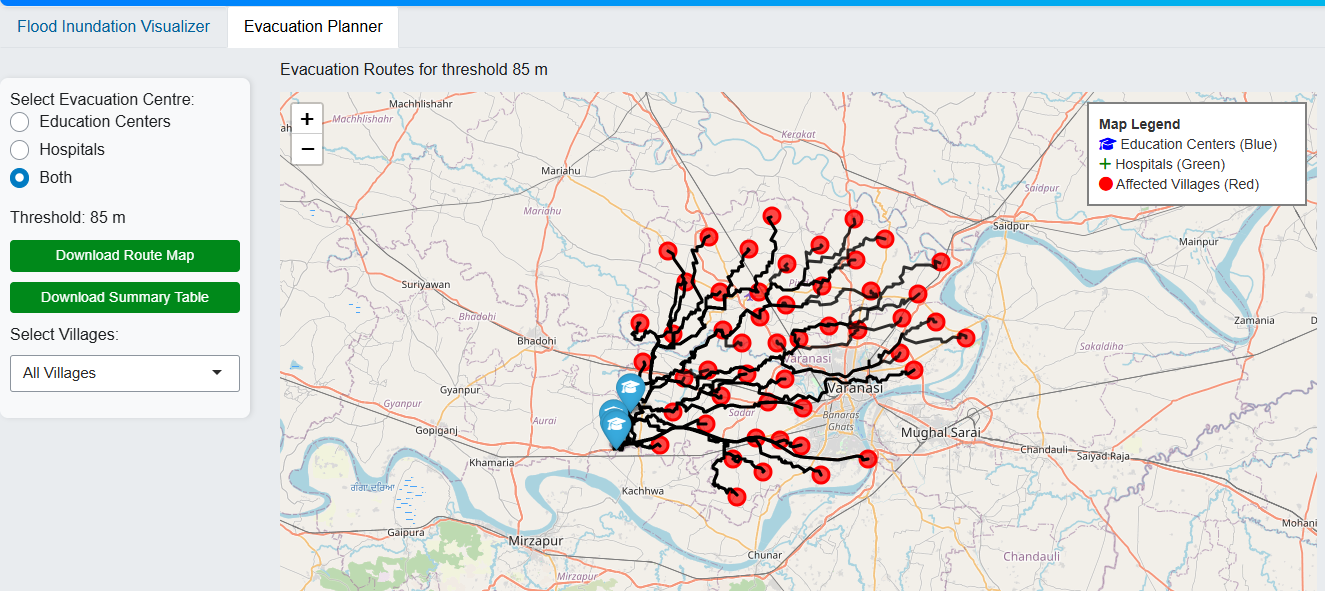
Figure 2. Evacuation Planner tab of the dashboard displaying functionalities like map display, option to select evacuation center and to export
Beyond its technical workflow, the Evacuation Planner offers significant operational advantages. By integrating clustering, hazard-aware routing, and multi-destination analysis, it ensures that evacuation decisions are both spatially coherent and contextually grounded in real flood dynamics. The elevation-aware routing enhances safety by prioritizing high-ground pathways, while the early-exit search strategy reduces processing time, enabling near–real-time response even under resource constraints. The combination of visual and tabular outputs improves situational awareness, supports transparent decision-making, and allows emergency teams to quickly prioritize villages, allocate resources, and coordinate field operations. Overall, the module transforms complex spatial analytics into actionable evacuation strategies, making it a powerful tool for disaster response and urban flood resilience.
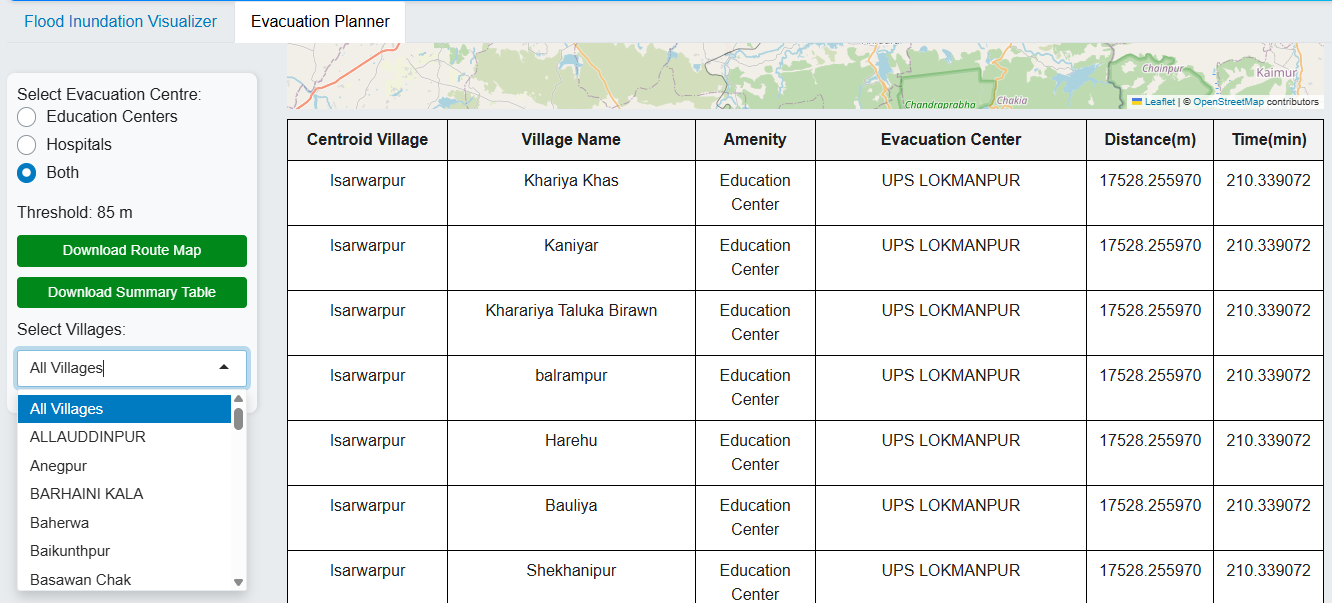
Figure 3. Evacuation Planner tab of the dashboard displaying tabular view of distance and time of travel from zone centroids to evacuation centers
Conclusion:
The Flood Impact and Response System (FIRS) Dashboard offers a comprehensive and practical solution for flood preparedness, impact assessment, and evacuation planning in Varanasi’s flood-prone urban environment. By integrating DEM-based flood inundation simulation with elevation-aware evacuation routing, the platform delivers fine-scale, actionable insights that support informed and timely decision-making. Its interactive maps, real-time visualization, and exportable route and impact summaries make it especially useful for emergency responders, planners, and local authorities who must quickly identify at-risk areas, evaluate safe routes, and coordinate evacuations during critical hours. The dashboard’s lightweight computational design ensures rapid scenario generation, allowing users to examine flood impacts for varying water-level thresholds and immediately understand which villages, roads, and facilities are affected.
While the system still faces limitations such as reliance on DEM accuracy, static evacuation site data it effectively demonstrates how open-source spatial data and efficient algorithms can be transformed into an accessible, operational tool for disaster management. Looking ahead, integrating real-time flood and traffic updates, dynamic population data, multi-hazard layers, and broader accessibility features would significantly enhance its effectiveness. With these advancements, FIRS has strong potential for scaling to other flood-vulnerable regions across India, contributing meaningfully to improved urban flood resilience and emergency response capabilities.
For more information, please visit: https://firs.geospatial.org.in/
Reference
- https://ndrf.gov.in/sites/default/files/FLOOD.pdf
- Mallikarjun Mishra*1 , Vikas Dugesar2 , and K.N.Prudhvi Raju3 “Flood Risk and Impact Analysis of Varanasi City Region, India”Volume 66, Issue 1, 2022 Journal of Scientific Research of The Banaras Hindu University. DOI: 10.37398/JSR.2022.660103
- Vikas Yadav1 · Ashutosh Kainthola1 · Gaurav Kushwaha1 · Vishnu H. R. Pandey1 · Abhi S. Krishna” Assessing the impact of urbanization on flood patterns in Varanasi,
India using Google Earth Engine” https://doi.org/10.1007/s44327-025-00051-9 - Yogesh Kumar Singh 1,*,Upasana Dutta 1,T. S. Murugesh Prabhu 1,I. Prabu 1,Jitendra Mhatre 1,Manoj Khare 1,Sandeep Srivastava 1 and Subasisha Dutta 2
“Flood Response System—A Case Study” https://doi.org/10.3390/hydrology4020030< /li>
Authors
Sneha R
Related Posts


