Introduction
Runoff is a vital component in hydrological modeling, particularly in regions with seasonal rainfall such as India. The Soil Conservation Service Curve Number (SCS-CN) model is commonly used to estimate runoff by considering land use, soil type, rainfall, and Antecedent Moisture Conditions (AMC). This study applies the SCS-CN model to assess runoff in Varanasi, focusing on the Southwest Monsoon (SWM) season, which spans from July to October.
The study integrates multiple datasets, including daily rainfall data from the India Meteorological Department (IMD), aggregated monthly and mean rainfall data for specific years from CHIRPS, land use/land cover (LULC) data from the Survey of India (SOI), and soil texture data from ICAR, to estimate runoff in the region. These datasets are accessible through the Integrated Geospatial Data-sharing Interface (https://catalogue.geospatial.org.in/).
These datasets help classify areas based on hydrological characteristics and moisture conditions, enabling accurate runoff predictions. The SCS-CN model calculates runoff by incorporating factors like the Curve Number (CN) and antecedent moisture conditions, providing insights into runoff dynamics and flood risk across Varanasi. By understanding how land use, soil type, and rainfall interact, this study aims to inform flood management strategies and water resource planning, particularly in urban areas like Varanasi.
Table 1 Shows the datasets used in the use cases.
| Datasets | Spatial Resolution | Temporal Resolution | Source |
|---|---|---|---|
| Rainfall data | – | Daily | https://catalogue.geospatial.org.in/dataset/9a9a1bc7-1b08-43d1-b500-7e0ebd1432d2 |
| Rainfall data | 5.3 km | Monthly, Yearly | https://data.chc.ucsb.edu/products/CHIRPS-2.0/global_monthly/tifs/ |
| Land use/ Land cover | – | – | Land use: https://catalogue.gdi.cdpg.org.in/dataset/0dd5d1d1-0cfe-4ac4-a4cf-13a3afd88cb1 Land Cover: https://catalogue.gdi.cdpg.org.in/dataset/fd519fbb-c68a-4201-9d28-d013dfb51d7f |
| Soil texture | – | – | https://catalogue.geospatial.org.in/dataset/8fdc2dba-f0e6-4b94-8269-7dede6a6cd9b |
Methodology
For this study, rainfall datasets were collected from multiple sources for the period covering the SWM season, from July to October. Five-day cumulative precipitation data was obtained from the IMD, while monthly composite rainfall data was sourced from CHIRPS-2.0. Additionally, mean rainfall data for specific years was included for further analysis.
LULC data for Varanasi was downloaded and merged, categorizing major classes such as agricultural land, water bodies, and built-up land. Soil texture data from ICAR was classified into four Hydrologic Soil Groups (HSG): A, B, C, and D, based on standard classification tables.
Subsequently, a spatial overlay of the LULC and HSG layers was performed to generate unique LULC-HSG combinations, each assigned a CN value. The CN Raster II was generated and used to derive CN Raster I and CN Raster III using the following equations:
CNI = CNII / (2.281 – 0.0128 * CNII)
CNIII = CNII / (0.427 + 0.00573 * CNII)
The antecedent moisture condition (AMC) was computed from the five-day cumulative precipitation raster, classifying precipitation into AMC I (<13 mm), AMC II (13-20 mm), and AMC III (>20 mm). CN values were adjusted accordingly, producing separate CN rasters for each AMC category as follows:
AMC I: CN1 Raster
AMC II: CNII Raster
AMC III: CNIII Raster
Seasonal monthly total rainfall and seasonal mean rainfall were used to compute monthly and annual runoff rates, respectively. Initial abstraction (Ia) was calculated using Ia = 0.2 × S, where S represents the potential maximum retention, derived using S = (25400 / CN) – 254. The runoff (Q) was then estimated using the SCS-CN equation: Q = (P – Ia)^2 / (P – Ia + S), where P represents rainfall.
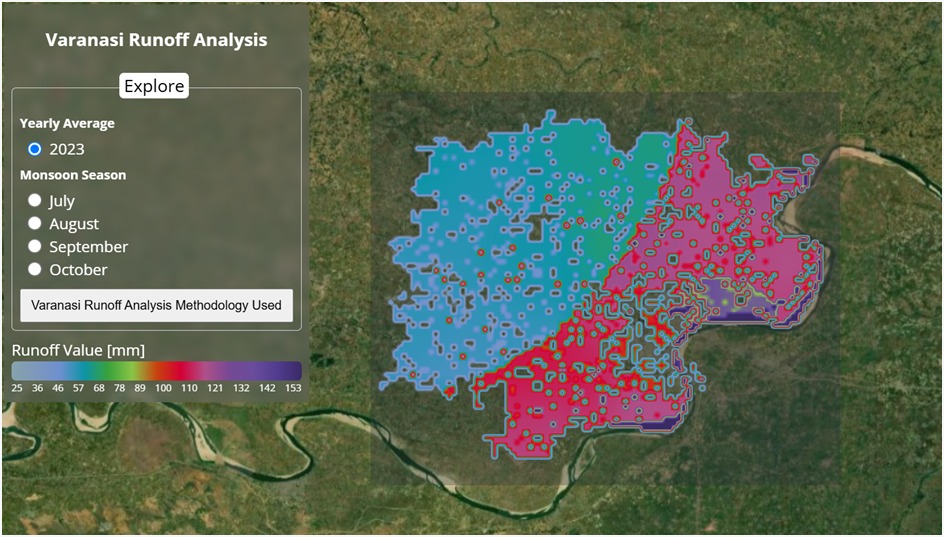
Fig. 1 Shows the runoff rate for Varanasi in 2023, with maximum runoff observed in the southern and eastern parts of the city. This is primarily due to higher rainfall in these areas, coupled with the presence of built-up land, such as roads and buildings, which reduces soil permeability and increases surface runoff. As move toward the western parts, the runoff rate decreases, which can be attributed to more permeable soils, lower rainfall intensity, and the presence of agricultural land that allows greater water absorption and infiltration, reducing the overall runoff in these areas.
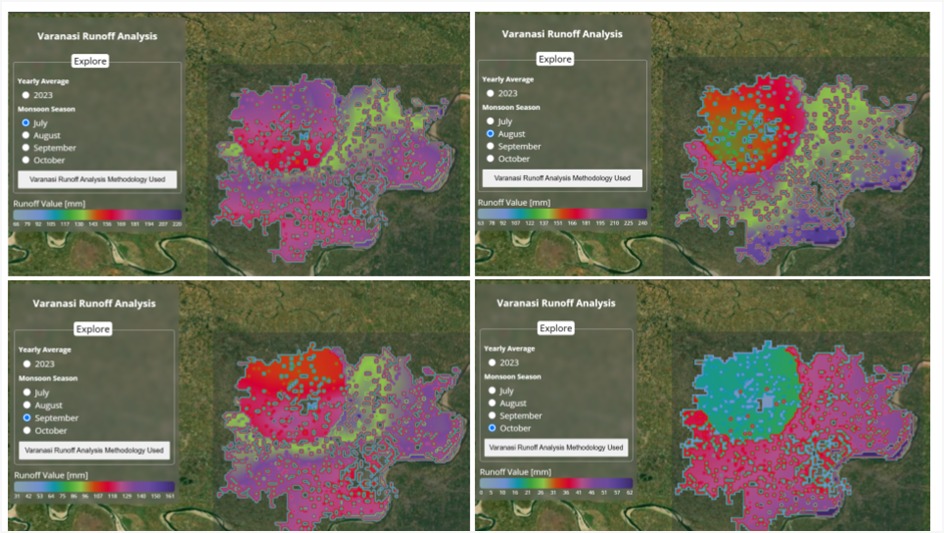
Fig. 2 Shows the monthly total runoff rates for Varanasi in July, August, September, and October 2023. The highest runoff is observed in July and August, which is characteristic of the peak Southwest Monsoon period. This is followed by a decrease in runoff in September and October. The runoff pattern in the early monsoon months is higher due to intense rainfall and less time for the soil to absorb water. In contrast, the reduced runoff in September and October results from lower rainfall and increased soil absorption.
Authors
Sandeep P
Related Posts


