Land Use Land Cover (LULC) classification is a vital process in remote sensing and geographic information systems. It categorizes Earth’s surface based on physical cover (e.g., forests, water, buildings) and human usage (e.g., agriculture, urban development, conservation). For instance, an area may have a land cover of ‘grass’ with a land use of ‘park’ or ‘golf course’. This classification, typically performed using satellite or aerial imagery, helps us understand and manage our changing planet. By employing methodologies like neural networks or decision trees, segmented regions are classified based on characteristics such as color, texture, and shape. This provides crucial insights for urban planning, environmental monitoring, and resource management. Our approach uses semi-supervised learning, leveraging both a large pool of unlabeled images and a small amount of labeled data. Using Convolutional Neural Networks (CNNs), this method enhances classification accuracy by effectively learning from the available data.
DATA COLLECTION
In LULC classification, two main types of data are used: Raster data and Vector data.
Raster Data Acquisition – Raster data consists of a matrix of cells (pixels), each representing a value of information, typically reflected light or electromagnetic radiation. It’s like a digital photograph composed of a grid of pixels where each pixel represents a specific area on the Earth’s surface and the size of the area each pixel represents is called the spatial resolution.
Cartosat-3 Multispectral (MX) imagery – This high-resolution satellite imagery from an Indian satellite captures data at multiple wavelengths, including visible light and near-infrared. With a spatial resolution of 0.75 m, each pixel represents a 0.75 m x 0.75 m area, enabling detailed urban analysis. The data, acquired from the NRSC (National Remote Sensing Centre) portal, hosts a huge catalog of data products from ISRO and various Indian Missions.
Vector Data Acquisition – Vector data represents geographic features as points, lines, or polygons. It’s used to precisely define the boundaries of features like buildings, roads, and water bodies.
JOSM (Java OpenStreetMap Editor)
Training Data
OpenStreetMap is a collaborative project to create a free, editable map of the world. The data from OpenStreetMap was used to train the machine learning models.
Microsoft Buildings – Validation Data
Microsoft Buildings is an AI-generated dataset of building footprints created by Microsoft. Predictions of this model was used to Validate our model
Google Buildings – Validation Data
Google using its AI algorithms also has its own dataset of building footprints and this was also used for validation.
Using both Microsoft and Google data for validation provides a more robust check on the model’s accuracy.
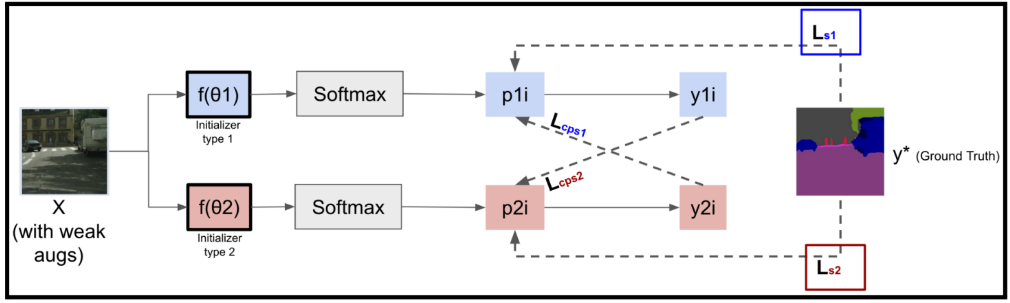
The CPS approach employs two cutting-edge DeepLab v3+ models to elevate the precision of land use classification in satellite imagery. This sophisticated architecture is renowned for its excellence in semantic segmentation tasks. Consequently, the system becomes adept at segmenting and classifying diverse and challenging landscapes, providing a formidable tool for environmental monitoring, urban planning, and resource management.
Figure 1. Cross Pseudo Supervision Semantic Segmentation
Figure 1: An example secure multiparty computation with four parties computing a common function F using their respective private data (A, B, C, D). Each party generates and sends shares of its private data to the other parties. The received shares are utilised locally to compute a function, G. The local outputs can subsequently be used to reconstruct the final answer, i.e., F(A, B, C, D).
APPLICATIONS
Urban Planning and Development
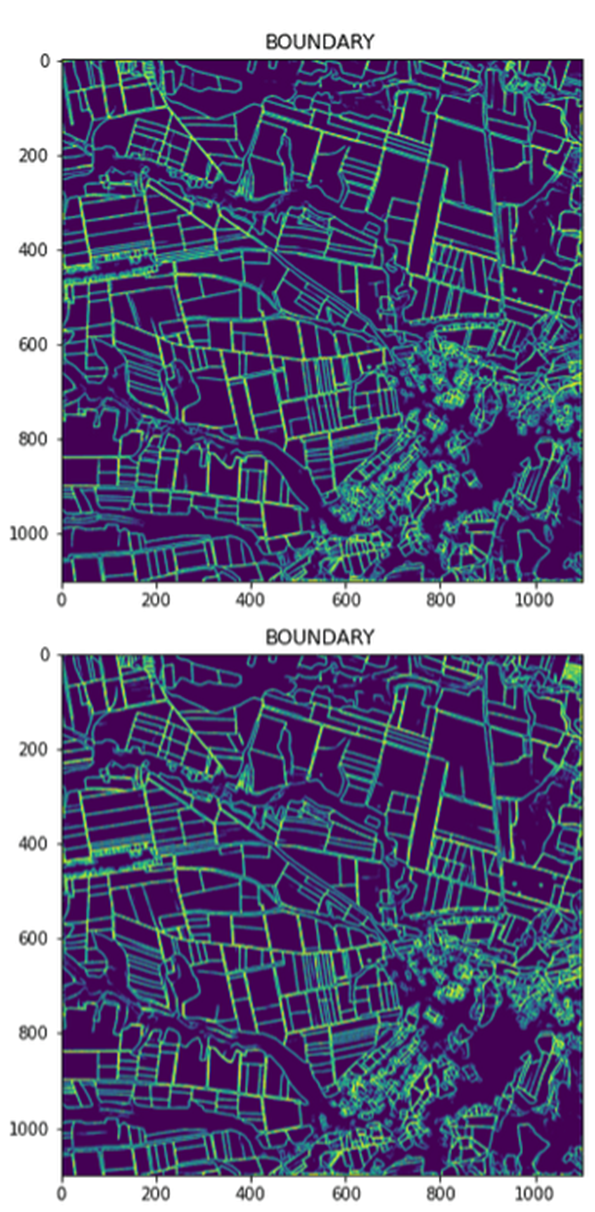
LULC data is vital for city planning and development, identifying areas for residential, commercial, and industrial use, and ensuring sustainable land management. It’s crucial for infrastructure planning, including roads and public utilities.
Figure 2. Property Boundary Detection
Agriculture and Land Management
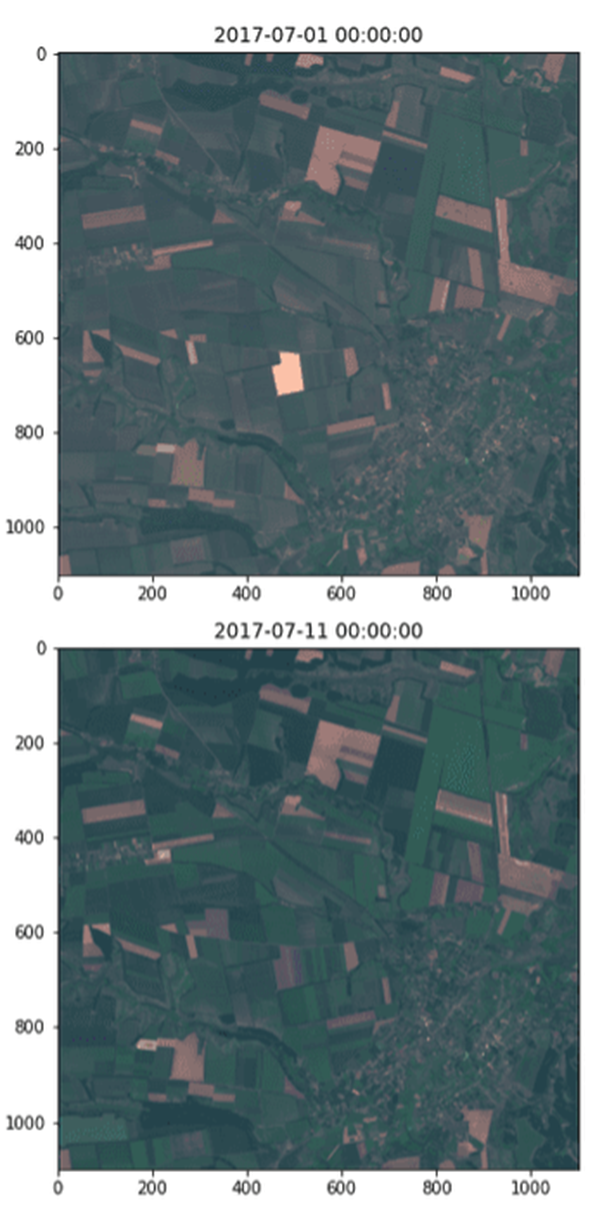
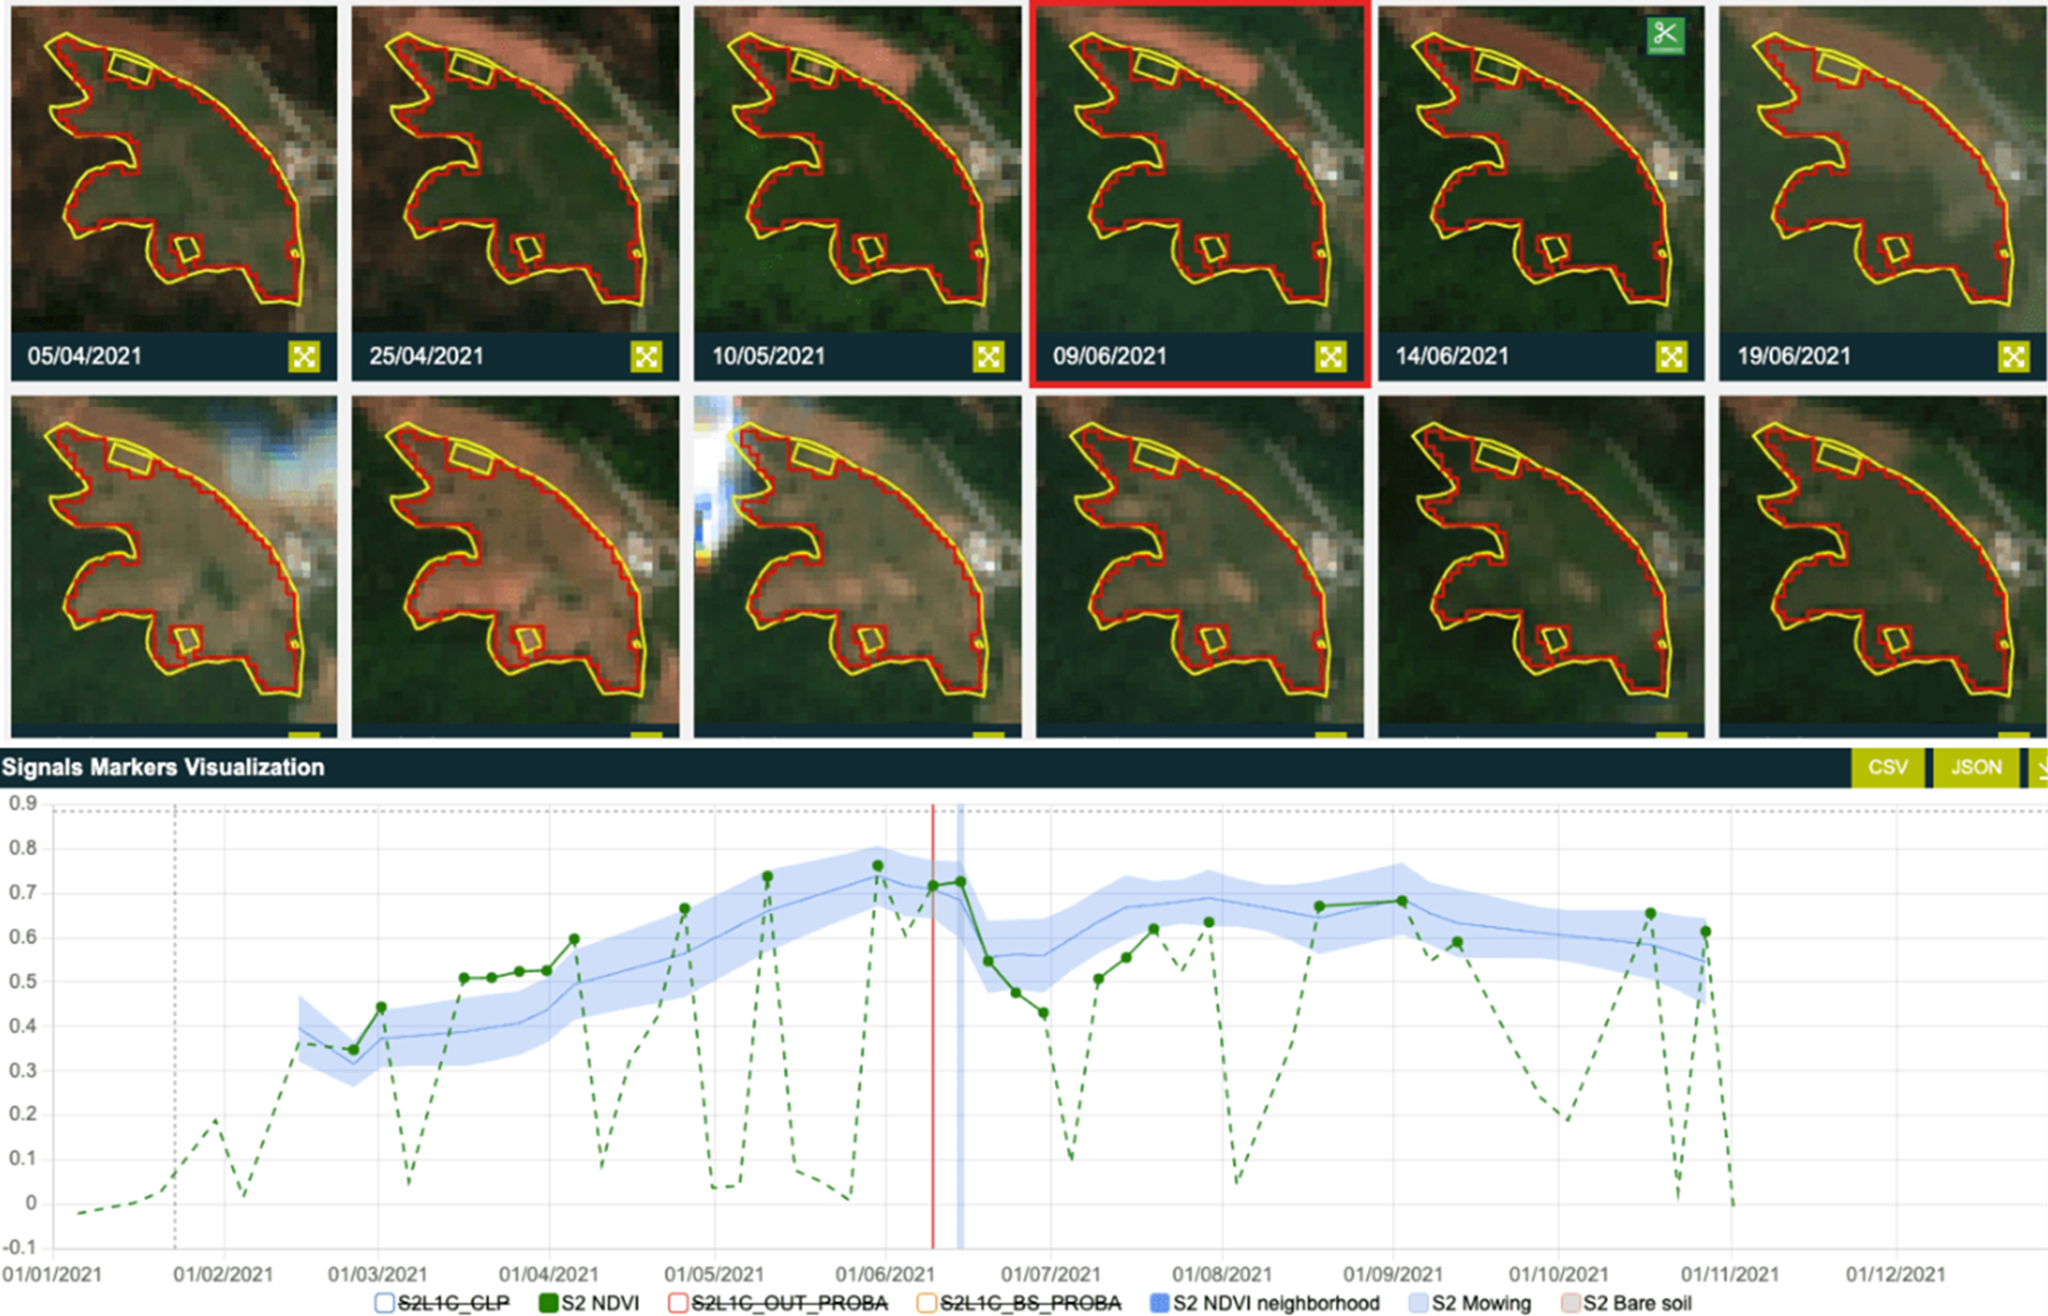
Farmers and land managers use LULC data to optimize crop planning, irrigation systems, and soil conservation practices. It helps in identifying arable lands and understanding the patterns of land use changes that affect agricultural productivity.
Figure 3. Land Crop Rotation Pattern Analysis
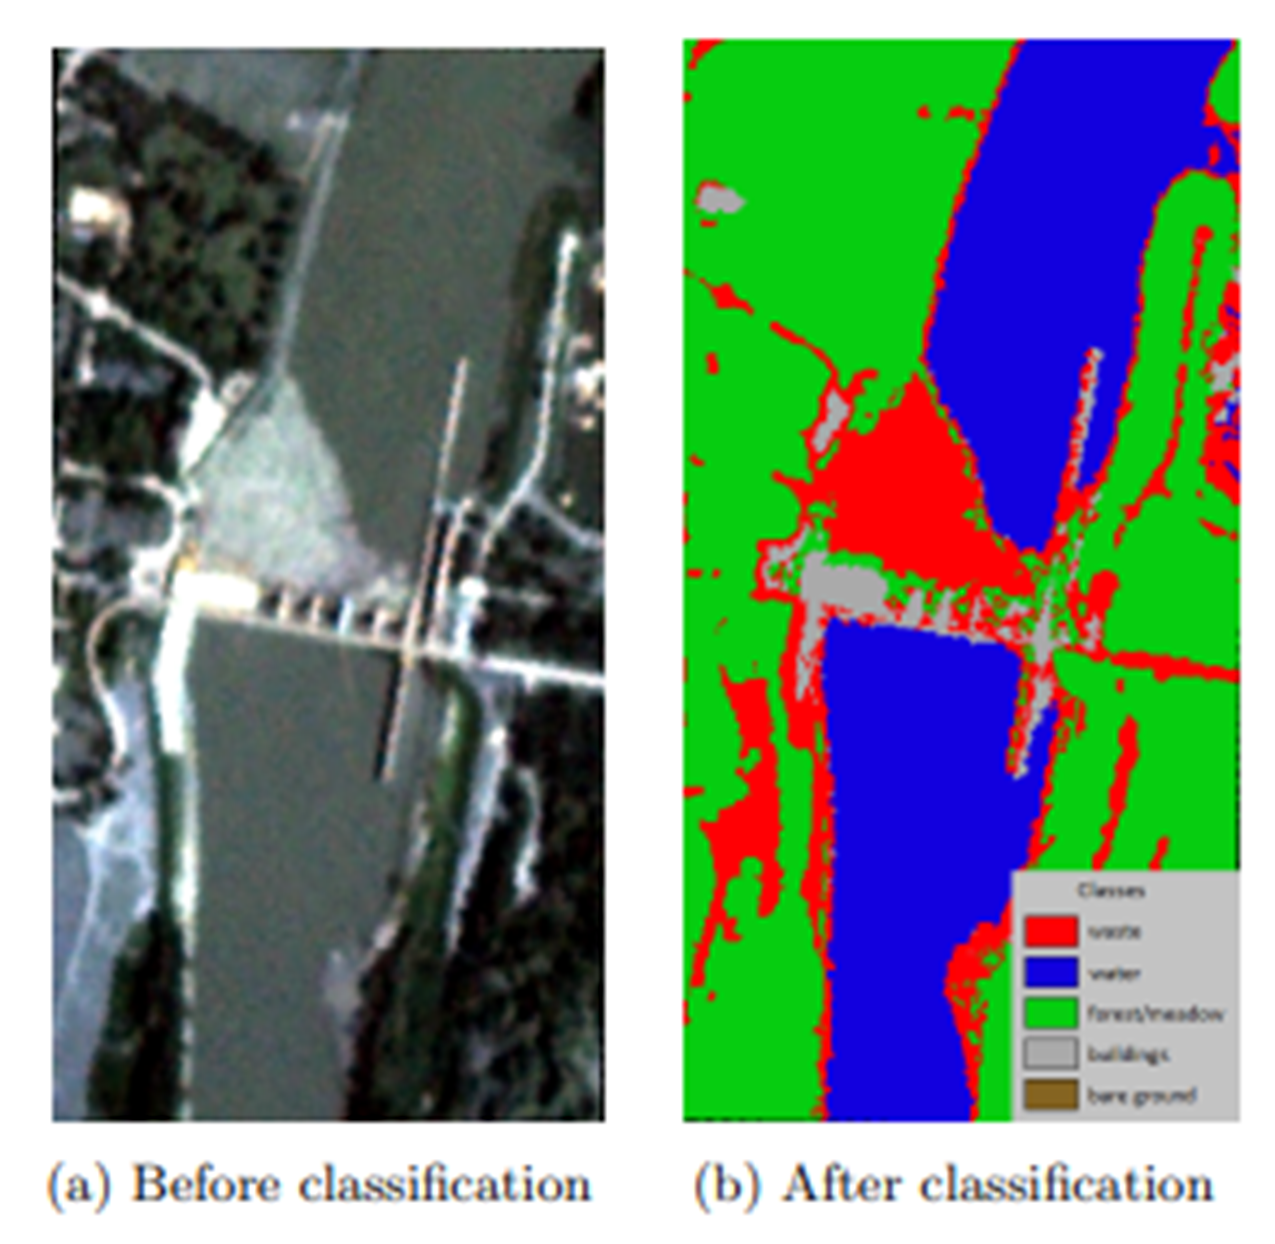
Environment and Natural Resource Monitoring
LULC classification helps monitor natural habitat, forest cover, wetlands, and ecosystems, crucial for conservation and biodiversity.
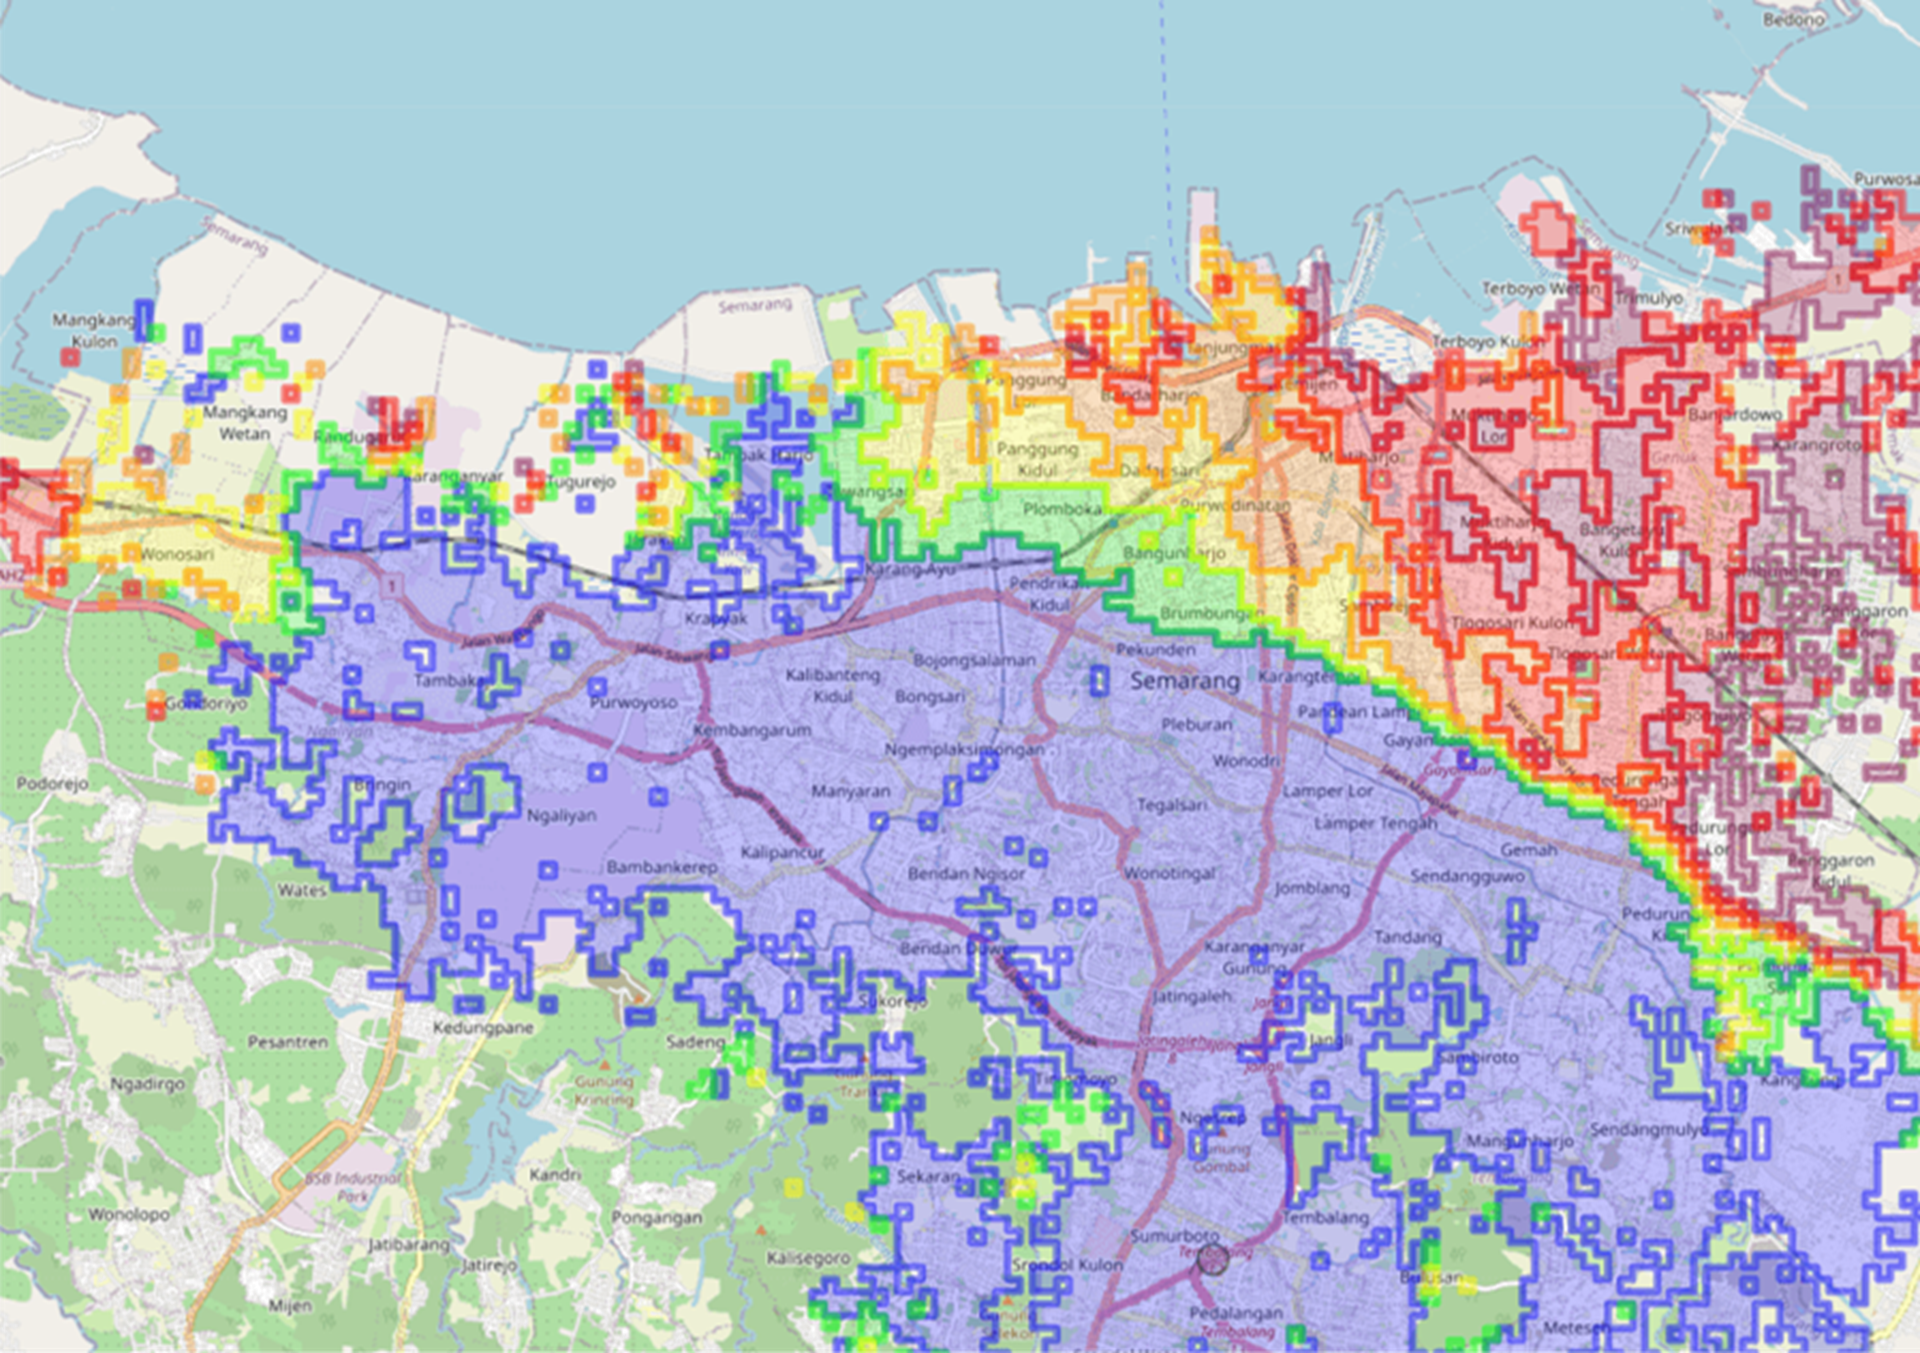
Policy Making and Governance — Policymakers use LULC data for making informed decisions on land use, zoning, and environmental laws, balancing development with conservation.
Figure 4. Green Cover Analysis
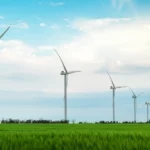
Climate Change Studies
LULC data is integral to climate change research. Changes in land cover, like deforestation or urbanization, impact the Earth’s climate system. Understanding these changes helps in modeling future climate scenarios and developing mitigation strategies.
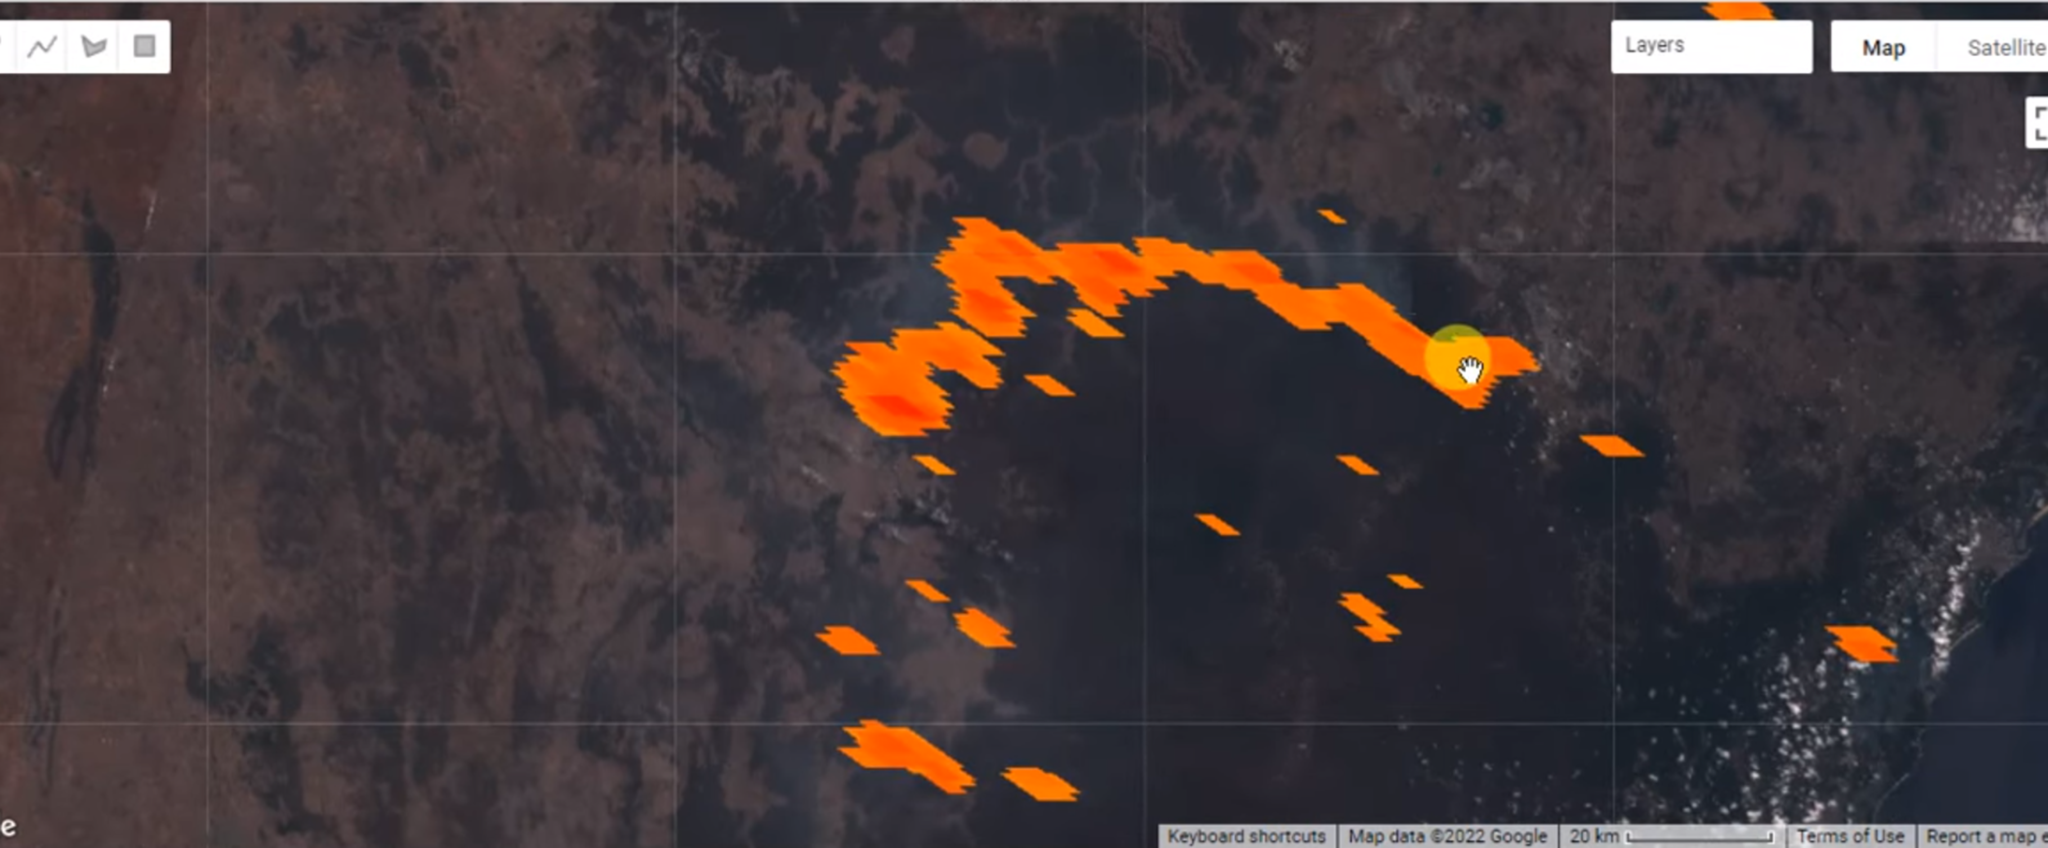
Figure 5. Forest Fire/ Stubble Burning Detection
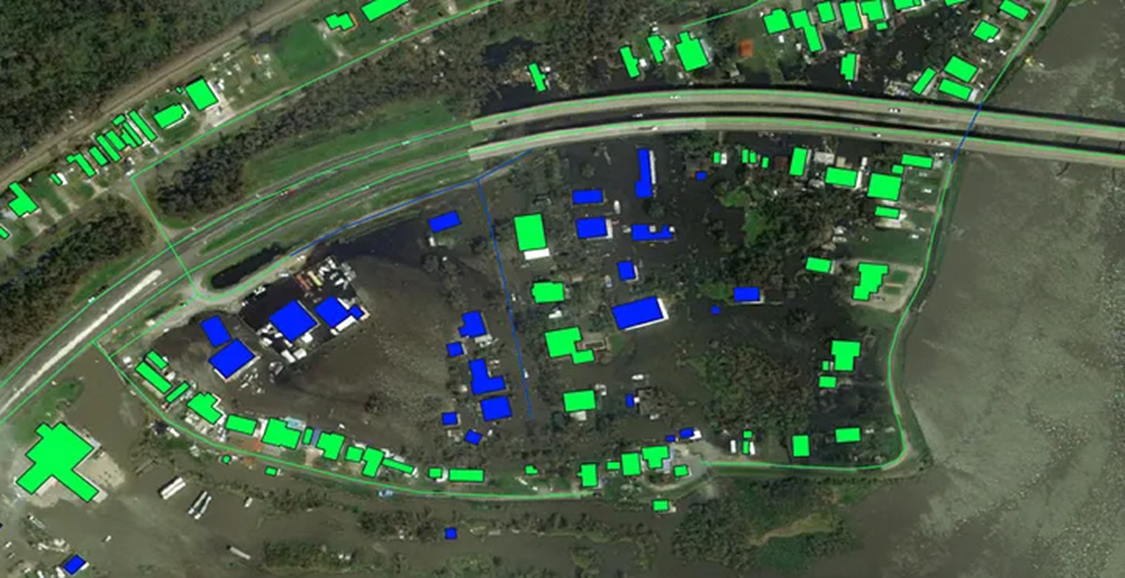
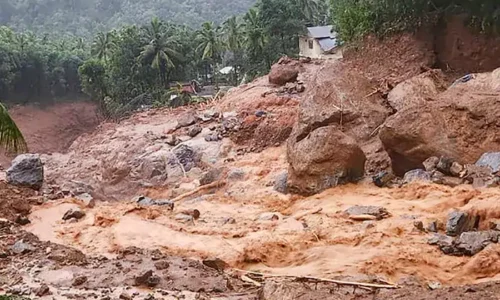
Disaster Management and Response
LULC classification provides valuable information for disaster management. It helps in assessing risk and vulnerability to natural disasters like floods, landslides, and forest fires, thereby aiding in emergency planning and response.
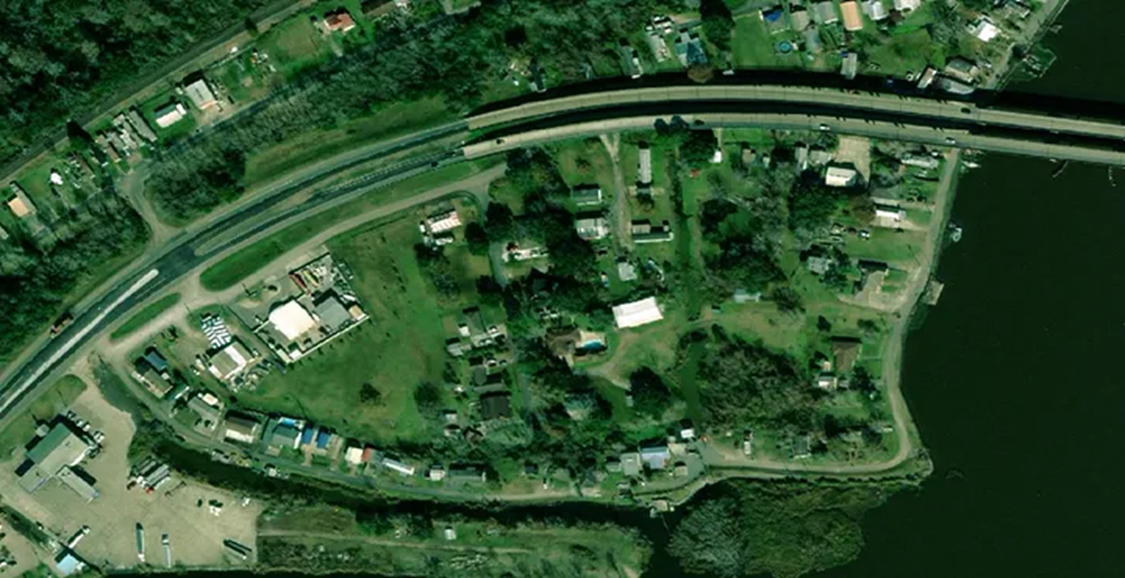
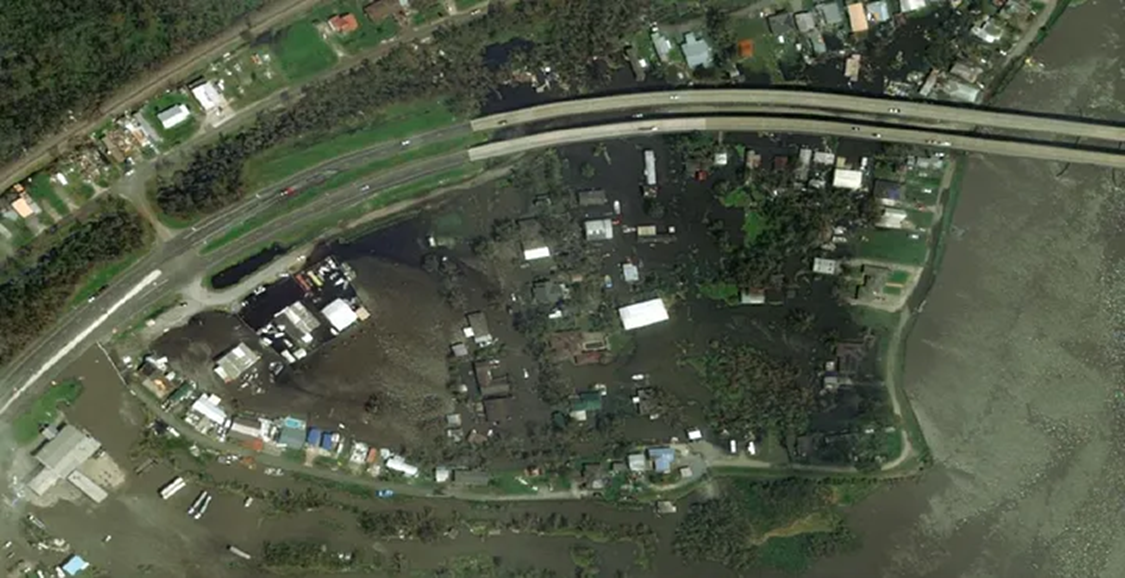
Before Flood After Flood Figure 6. Buildings affected by Flood Detection Analysis after segmentation
Water Resources Management
LULC data assists in water resource planning and management. It helps in understanding watershed characteristics and their changes over time, which is vital for managing water supply, quality, and flood control.
Figure 7. Froth or Foam Detection in Water Bodies
FUTURE WORK
Expand CartoSAT-3 Imagery Acquisition: Procure additional CartoSAT-3 satellite imagery from the NRSC, encompassing various cities and geographical regions. This expanded dataset will enable the models to adapt and perform more effectively across different vegetation types, urban landscapes, and more.
Broaden Label Diversity : Obtain a more comprehensive set of labels covering a wider array of classification categories. This includes distinguishing between different types of farmlands and vegetation, as well as differentiating between various building types, such as residential and commercial. This enriched labeling will further refine the models’ accuracy and applicability.
Founder of NaPanta®| Serial Entrepreneur | Digital Expert in Agri Ecosystem | REX Karmaveer Global Fellow | SLPian | tagged as Social Business Torch Bearer for India
Shri Timmana Gouda
Founder CEO, WhatsLoan
Shri Vineet Singh
Building impactful products at Digital Green
Shri Nipun Mehrotra (moderator)
Co-Founder & CEO, The Agri Collaboratory,
Co-creating Digital Public Goods for Agriculture – in Open Source with the Ecosystem & Government
Challenges in creating data policy and governance guidelines in the context of data for public good
Venue: Faculty Hall, Main Building
Time: 12 pm
Shri Mathew Chacko
Partner, Spice Route Legal
Shri Parminder Jeet Singh
Independent Digital Researcher
Ms Saranya Gopinath
Director, Government Affairs & Public Policy at Razorpay


